Property taxes are the primary tool for financing local governments. In fiscal year 2022, property taxes comprised 27.4 percent of total state and local taxA tax is a mandatory payment or charge collected by local, state, and national governments from individuals or businesses to cover the costs of general government services, goods, and activities. collections in the United States, more than any other source of tax revenue, despite being levied almost exclusively at the local (not state) level. Local governments rely heavily on property taxes to fund schools, roads, police departments, fire and emergency medical services, and other services associated with residency and property ownership. Property taxes accounted for 70.2 percent of local tax collections in fiscal year 2022.
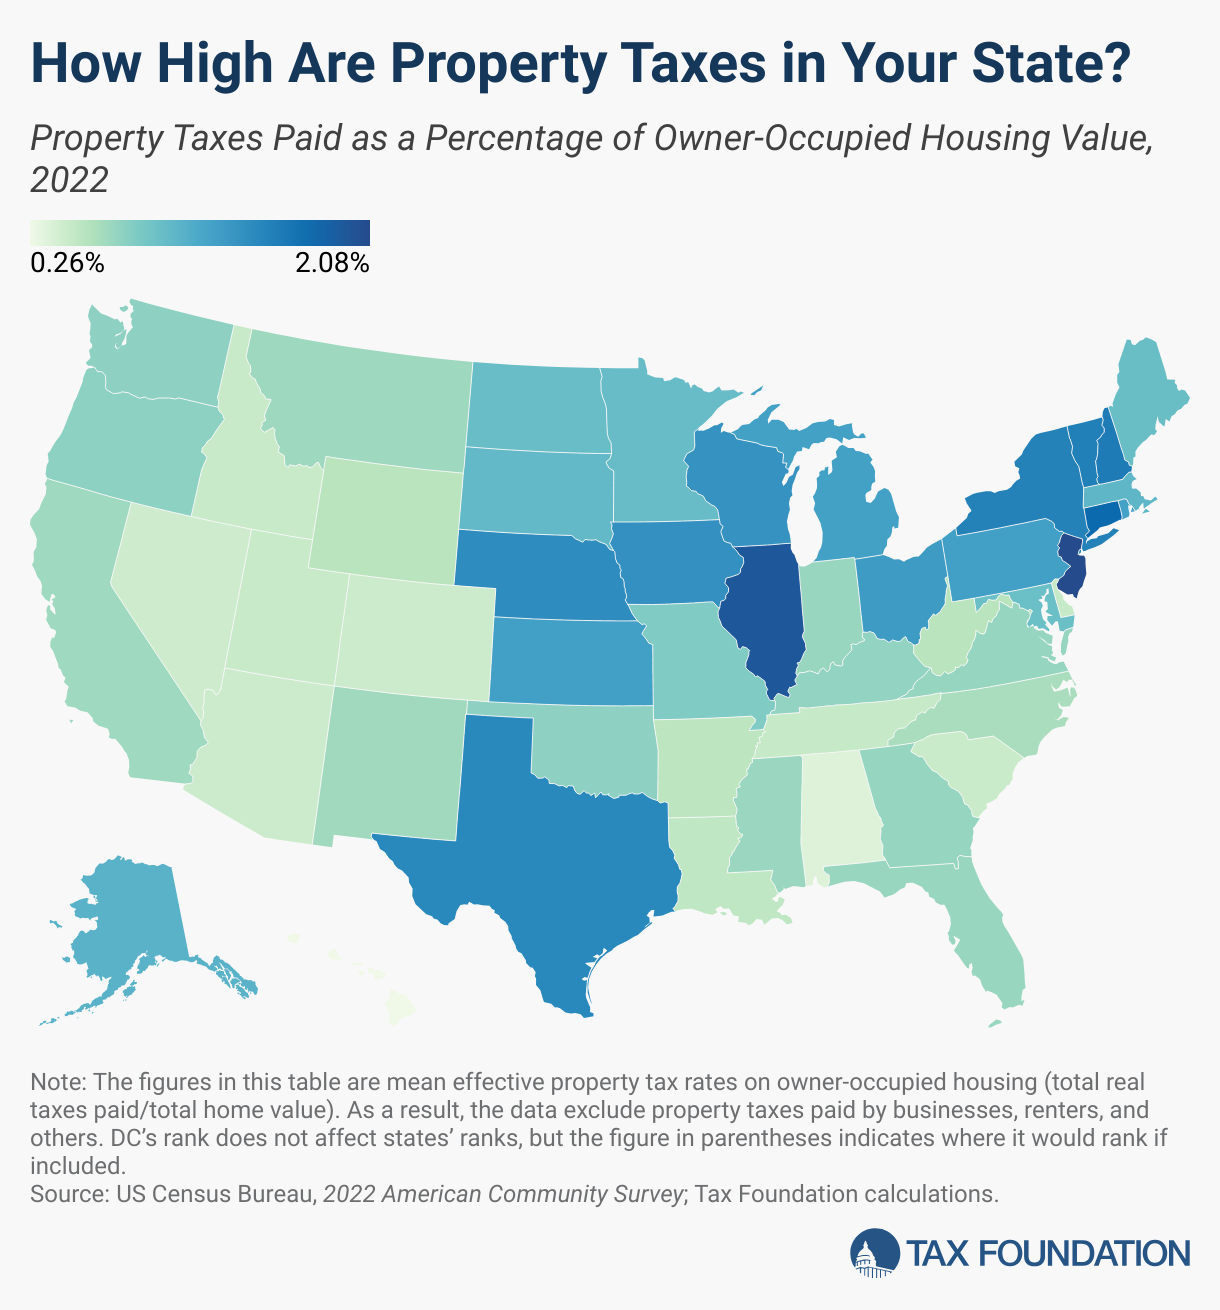
Some states with high property taxes, like New Hampshire and Texas, rely heavily on them in lieu of other major tax categories. This often involves greater devolution of authority to local governments, which are responsible for more government services than they are in states with greater reliance on state-level revenues like income or sales taxes. Other states, like New Jersey and Illinois, impose high property taxes alongside high rates in the other major tax categories.
While no taxpayers in high-tax jurisdictions will be celebrating their yearly payments, property taxes are largely rooted in the benefit principle of taxation: the people paying the property taxA property tax is primarily levied on immovable property like land and buildings, as well as on tangible personal property that is movable, like vehicles and equipment. Property taxes are the single largest source of state and local revenue in the U.S. and help fund schools, roads, police, and other services. bills are most often the ones benefiting from the services (think about K-12 education, local surface roads, police and fire service, and parks). As Joan Youngman argues, a well-designed property tax, despite being the target of frequent political attacks, can be considered a good tax since it is usually transparent, simple, and stable, satisfying most of the principles of sound tax policy. Property taxes also tend to be more economically efficient than alternative sources of tax revenue.
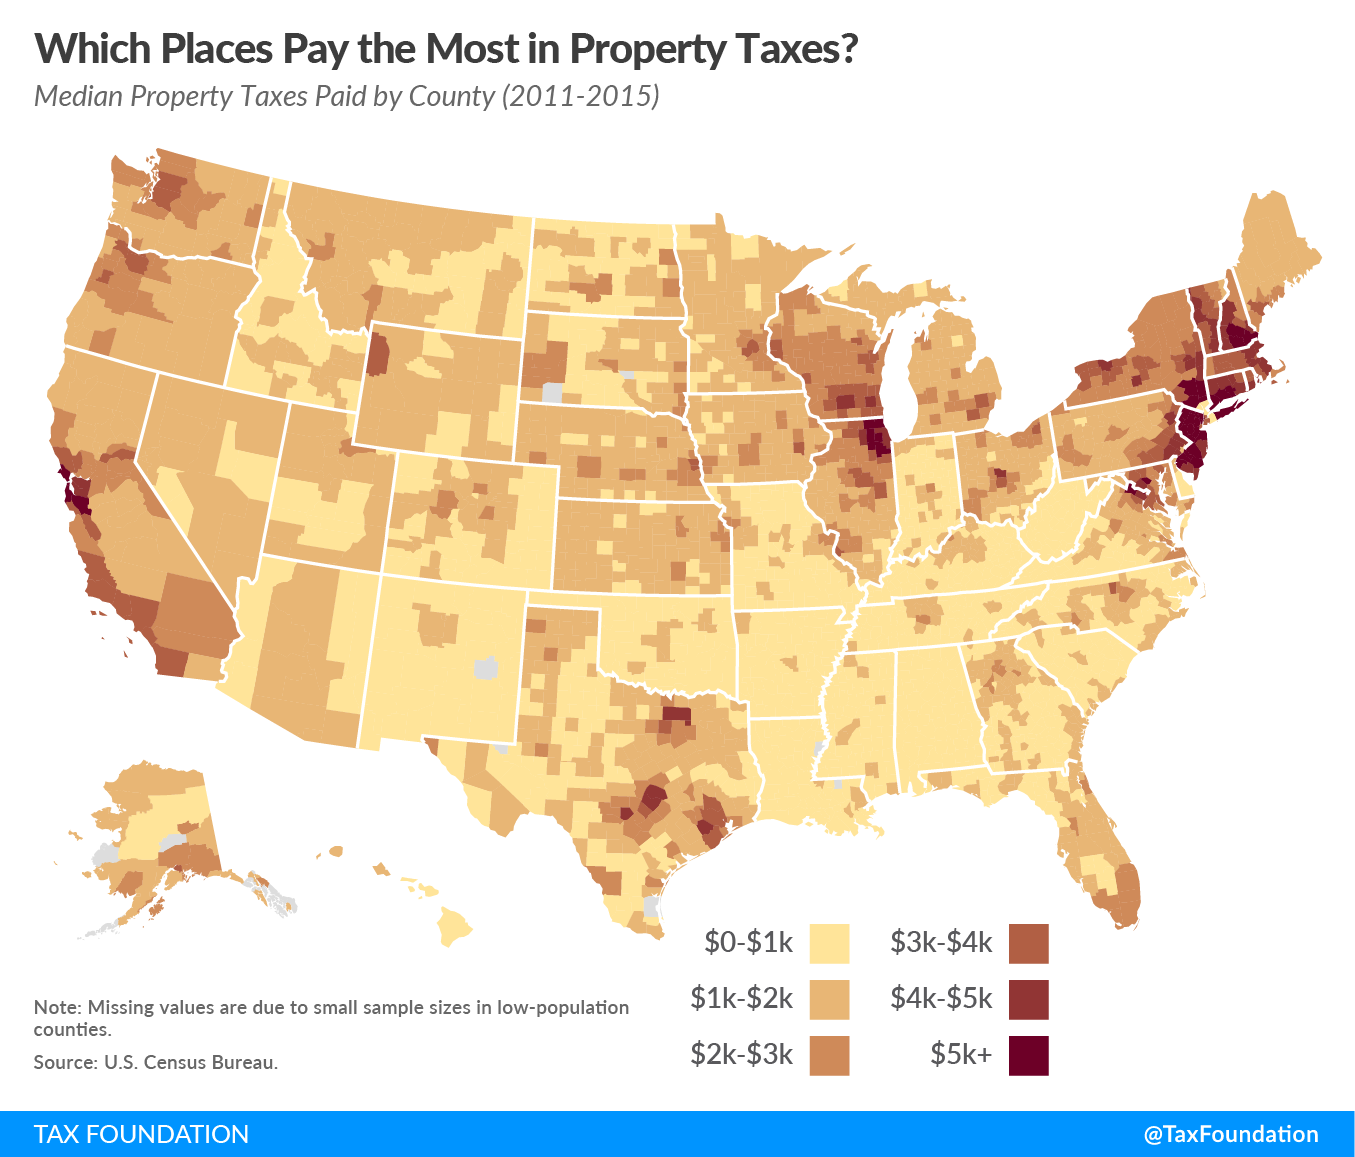
Because property taxes are almost invariably levied locally, and millages (rates) are not directly comparable with each other across states, providing a useful state-level comparison can be difficult. In an effort to present a multifaceted view, we feature two maps focused on the property tax. The first looks at median property tax bills and effective property tax rates in each county in the United States, and the second compares effective tax rates across states.
How does your county and state compare?


Table 1. Property Taxes by County
Median Property Taxes Paid by County, 2023 (5-year estimate)
| State | County | Median Housing Value, 2023 ($) | Median Property Taxes Paid, 2023 ($)(5-Year Estimate) | Effective Property Tax Rate (2023) |
|---|---|---|---|---|
| Alabama | Autauga County | 197900 | 564 | 0.2850% |
| Alabama | Baldwin County | 287000 | 881 | 0.3070% |
| Alabama | Barbour County | 109900 | 415 | 0.3776% |
| Alabama | Bibb County | 132600 | 271 | 0.2044% |
| Alabama | Blount County | 169700 | 508 | 0.2994% |
| Alabama | Bullock County | 79400 | 309 | 0.3892% |
| Alabama | Butler County | 99700 | 342 | 0.3430% |
| Alabama | Calhoun County | 149500 | 610 | 0.4080% |
| Alabama | Chambers County | 129700 | 496 | 0.3824% |
| Alabama | Cherokee County | 165900 | 643 | 0.3876% |
| Alabama | Chilton County | 142300 | 478 | 0.3359% |
| Alabama | Choctaw County | 111800 | 199 | 0.1780% |
| Alabama | Clarke County | 126400 | 388 | 0.3070% |
| Alabama | Clay County | 144700 | 326 | 0.2253% |
| Alabama | Cleburne County | 144200 | 417 | 0.2892% |
| Alabama | Coffee County | 180300 | 615 | 0.3411% |
| Alabama | Colbert County | 161600 | 604 | 0.3738% |
| Alabama | Conecuh County | 101300 | 328 | 0.3238% |
| Alabama | Coosa County | 111800 | 303 | 0.2710% |
| Alabama | Covington County | 142500 | 358 | 0.2512% |
Table 2. Property Taxes by State
Property Taxes Paid as a Percentage of Owner-Occupied Housing Value, 2023
| State | Effective Tax Rate (2023) | Effective Tax Rate (2022) | Rank |
|---|---|---|---|
| Alabama | 0.36% | 0.31% | 49 |
| Alaska | 0.91% | 0.86% | 21 |
| Arizona | 0.44% | 0.42% | 48 |
| Arkansas | 0.53% | 0.49% | 39 |
| California | 0.70% | 0.65% | 32 |
| Colorado | 0.50% | 0.45% | 41 |
| Connecticut | 1.48% | 1.43% | 3 |
| Delaware | 0.50% | 0.46% | 40 |
| Florida | 0.74% | 0.64% | 30 |
| Georgia | 0.77% | 0.69% | 26 |
| Hawaii | 0.32% | 0.26% | 50 |
| Idaho | 0.48% | 0.44% | 44 |
| Illinois | 1.83% | 1.75% | 1 |
| Indiana | 0.77% | 0.68% | 27 |
| Iowa | 1.23% | 1.15% | 11 |
| Kansas | 1.19% | 1.08% | 12 |
| Kentucky | 0.73% | 0.67% | 31 |
| Louisiana | 0.55% | 0.50% | 37 |
| Maine | 0.94% | 0.85% | 20 |
| Maryland | 0.90% | 0.85% | 22 |
| Massachusetts | 0.97% | 0.91% | 18 |
| Michigan | 1.15% | 1.08% | 14 |
| Minnesota | 0.99% | 0.92% | 16 |
| Mississippi | 0.58% | 0.53% | 36 |
| Missouri | 0.88% | 0.79% | 23 |
| Montana | 0.60% | 0.53% | 35 |
| Nebraska | 1.43% | 1.32% | 4 |
| Nevada | 0.49% | 0.45% | 42 |
| New Hampshire | 1.41% | 1.37% | 6 |
| New Jersey | 1.77% | 1.73% | 2 |
| New Mexico | 0.61% | 0.59% | 34 |
| New York | 1.26% | 1.23% | 9 |
| North Carolina | 0.62% | 0.57% | 33 |
| North Dakota | 0.94% | 0.86% | 19 |
| Ohio | 1.31% | 1.23% | 8 |
| Oklahoma | 0.77% | 0.72% | 25 |
| Oregon | 0.78% | 0.73% | 24 |
| Pennsylvania | 1.19% | 1.14% | 13 |
| Rhode Island | 1.05% | 1.03% | 15 |
| South Carolina | 0.47% | 0.43% | 47 |
| South Dakota | 0.99% | 0.85% | 17 |
| Tennessee | 0.49% | 0.45% | 43 |
| Texas | 1.36% | 1.26% | 7 |
| Utah | 0.47% | 0.42% | 46 |
| Vermont | 1.42% | 1.33% | 5 |
| Virginia | 0.77% | 0.71% | 28 |
| Washington | 0.75% | 0.69% | 29 |
| West Virginia | 0.48% | 0.46% | 45 |
| Wisconsin | 1.25% | 1.21% | 10 |
| Wyoming | 0.55% | 0.47% | 38 |
| District of Columbia | 0.61% | 0.58% | 34 |
Source: US Census Bureau, 2023 American Community Survey; Tax Foundation calculations.
Data compiled by Andrey Yushkov
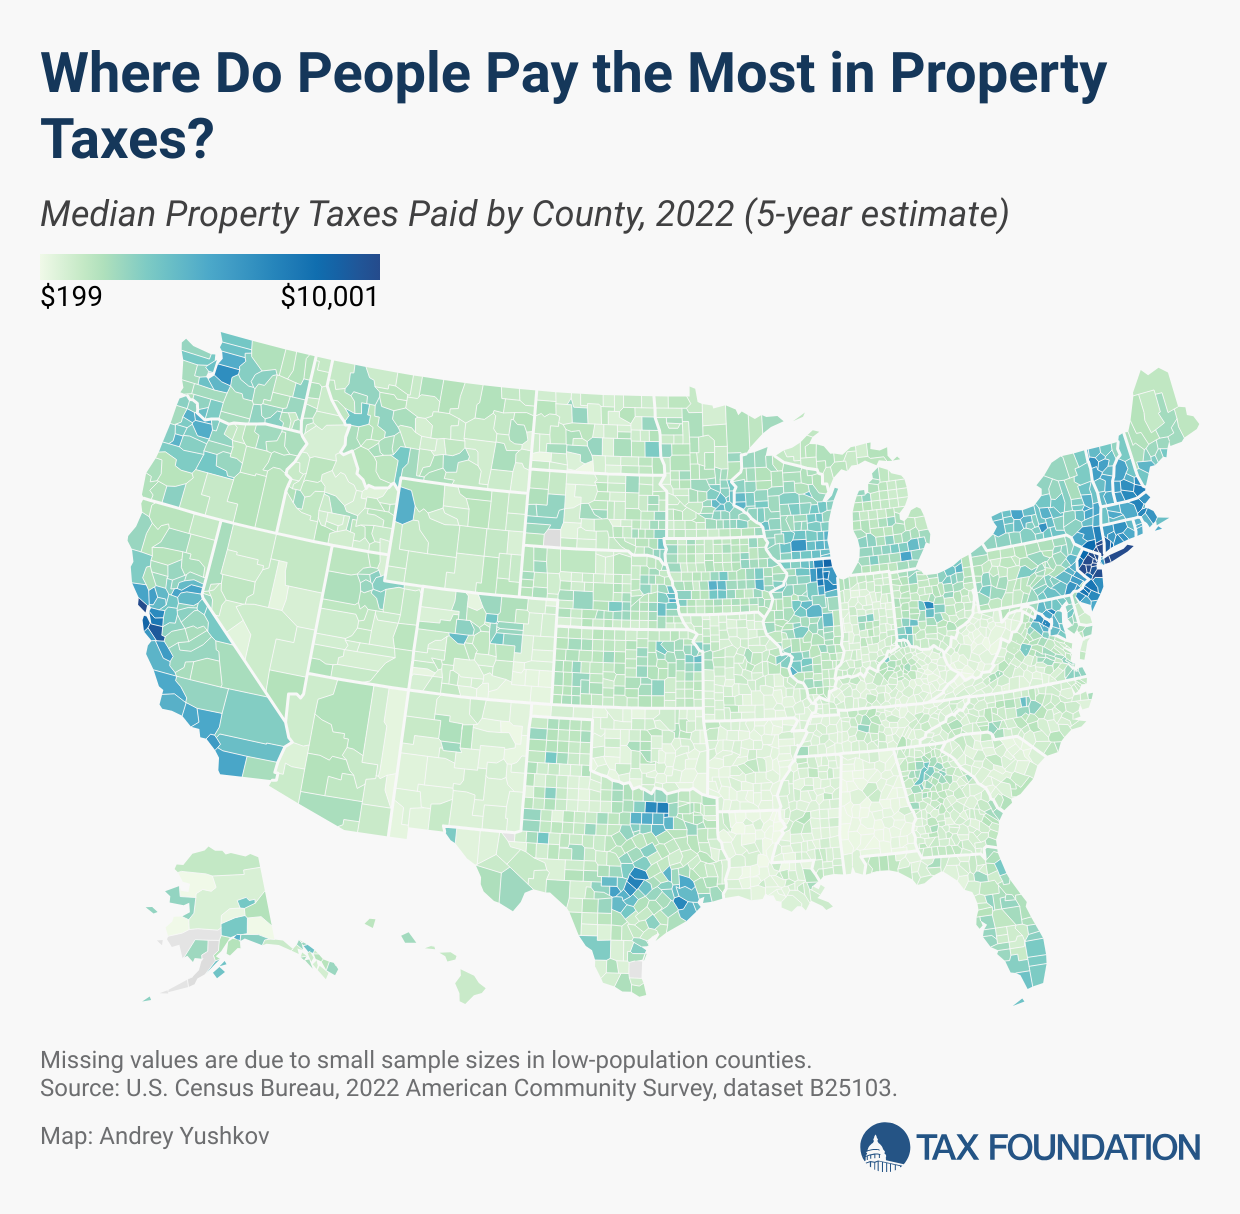
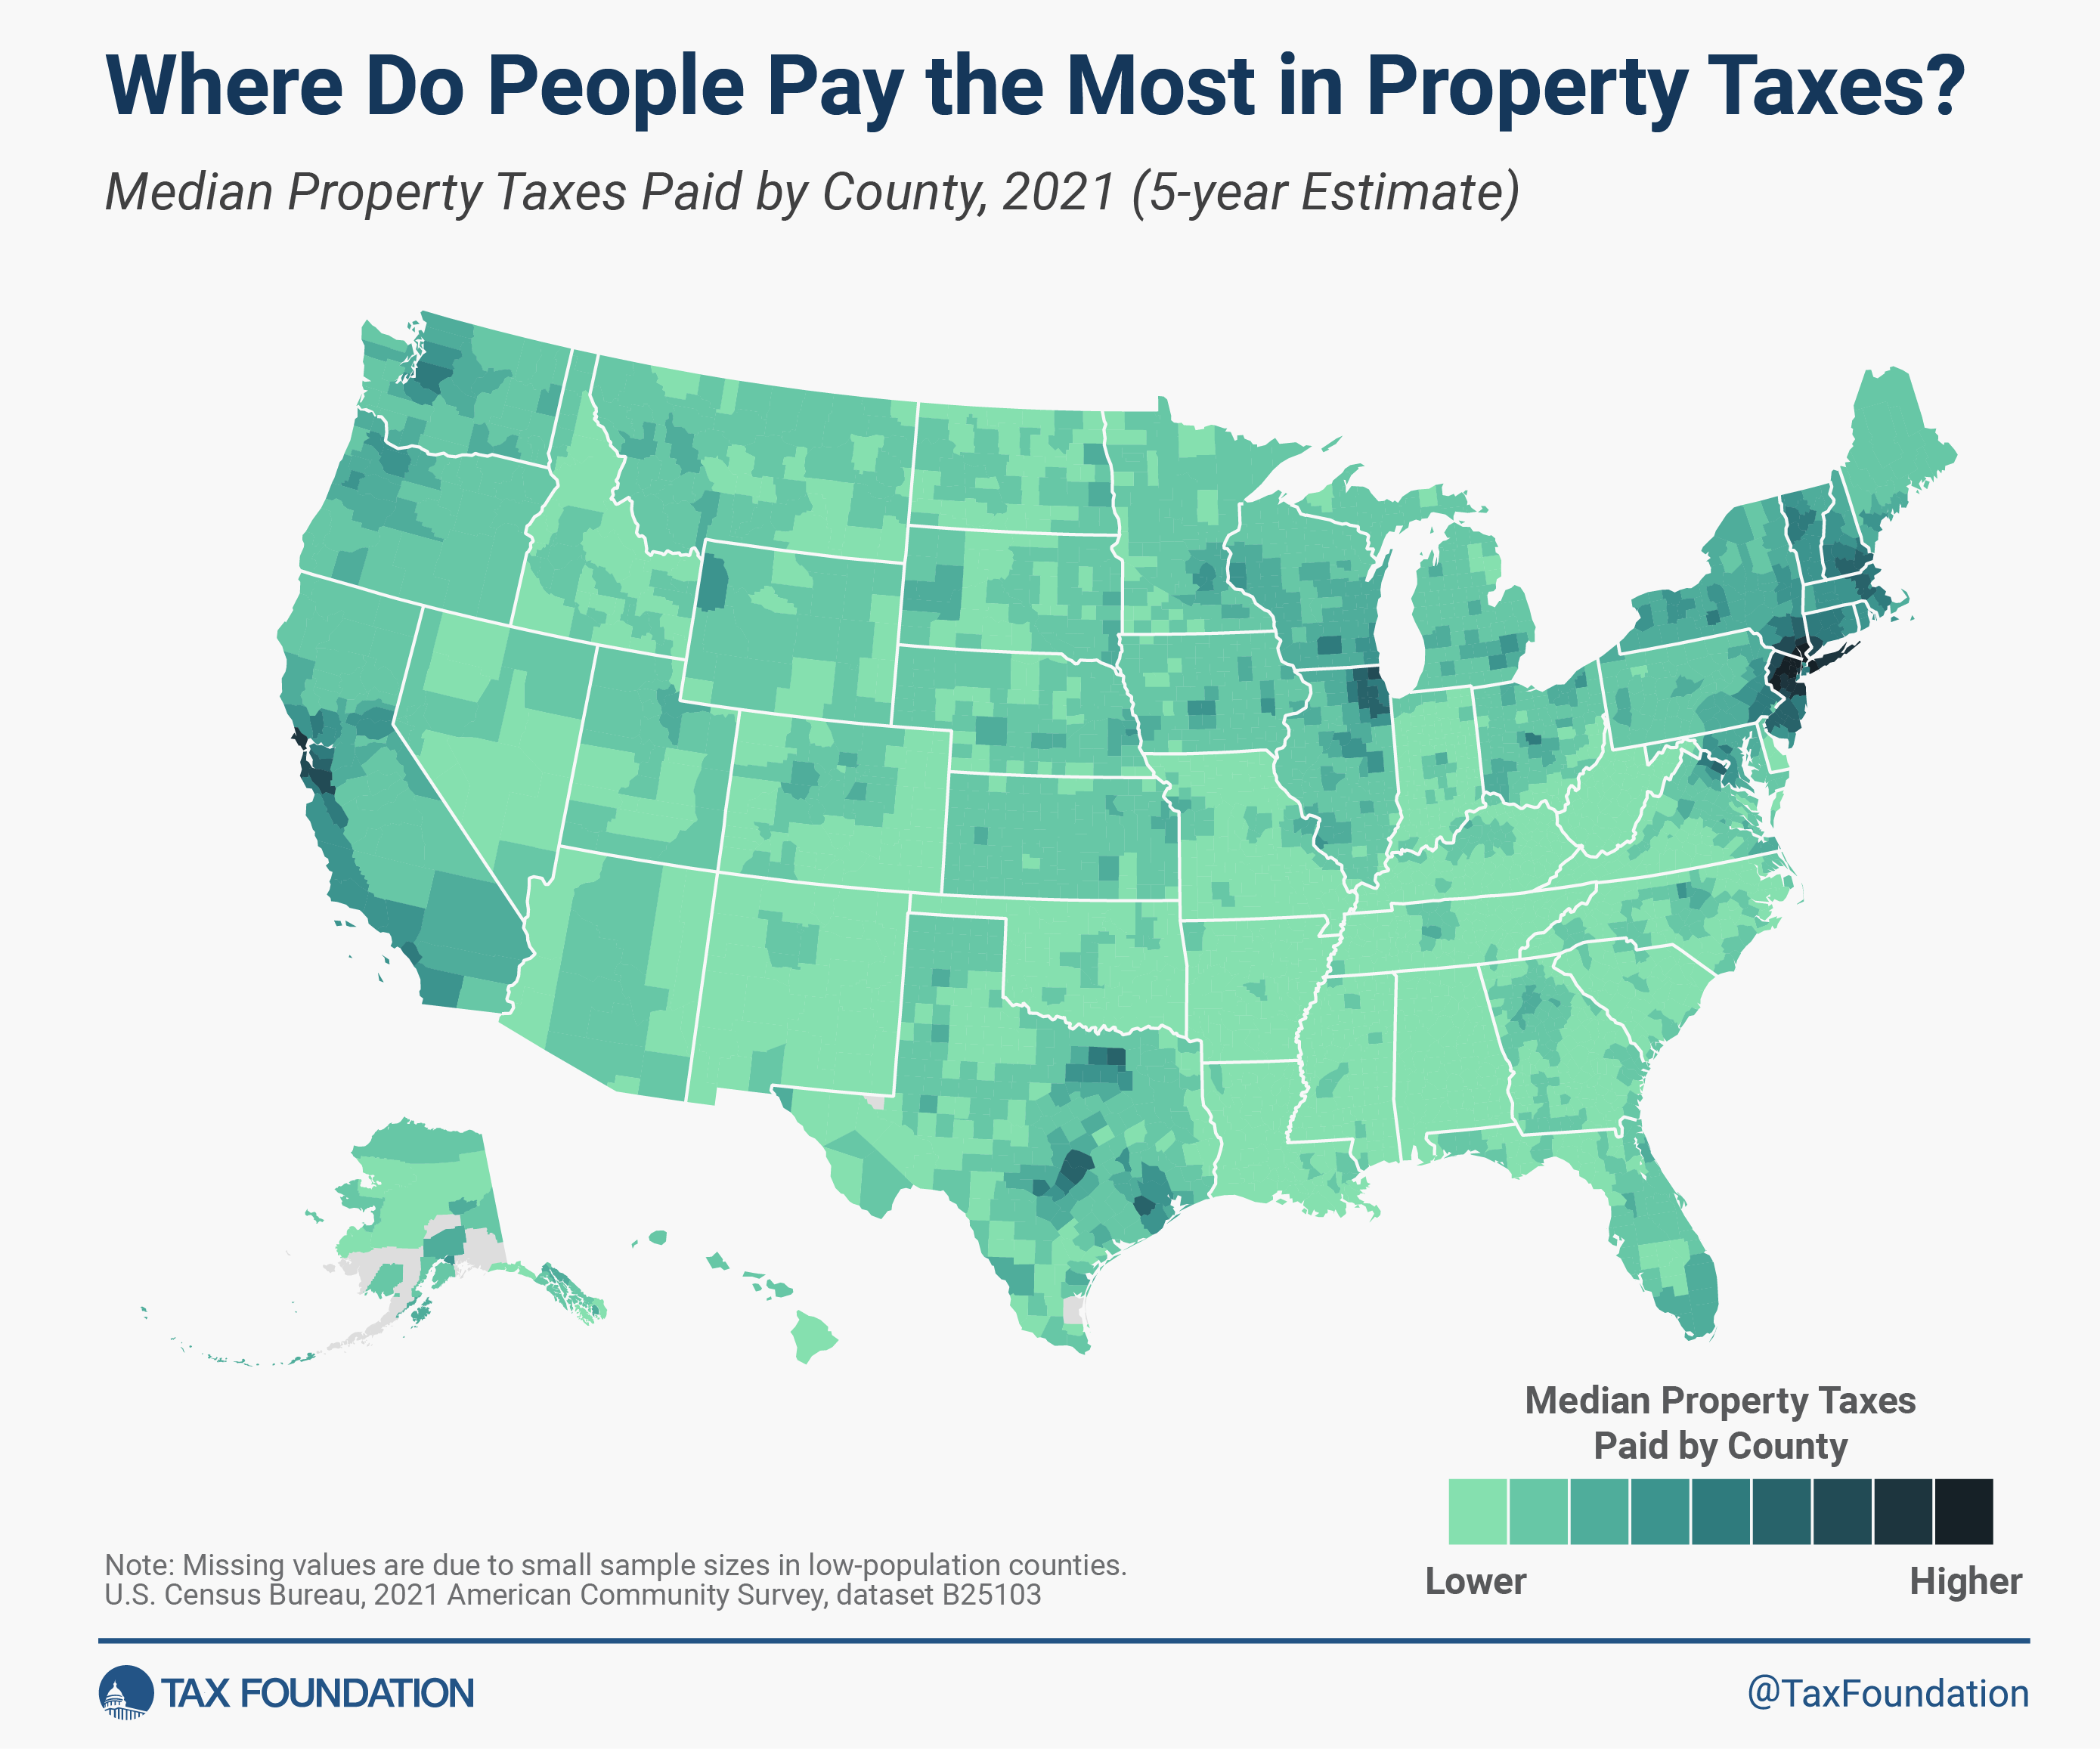
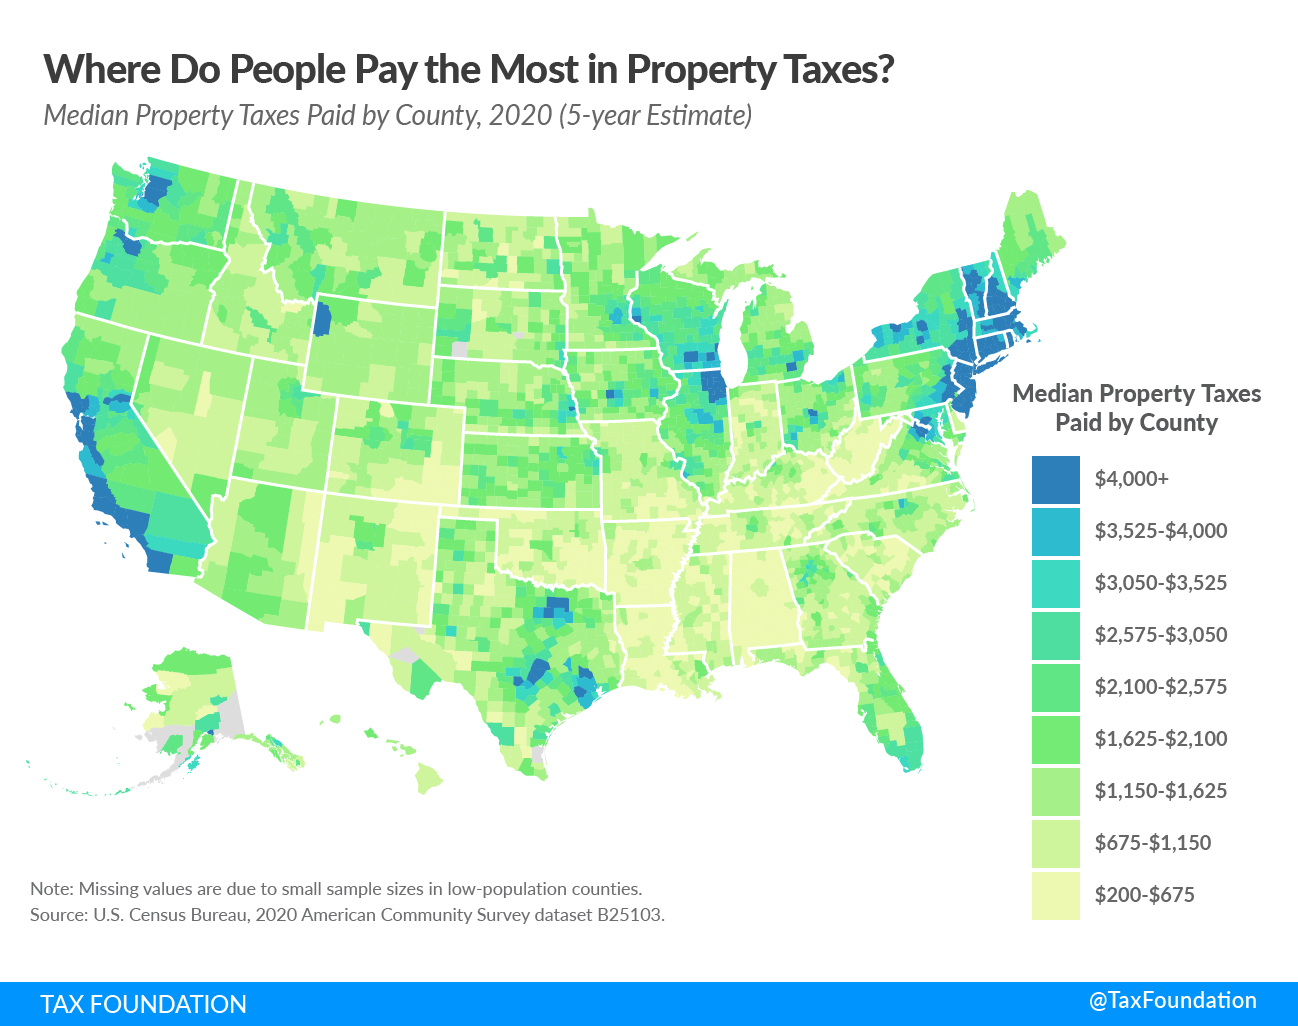
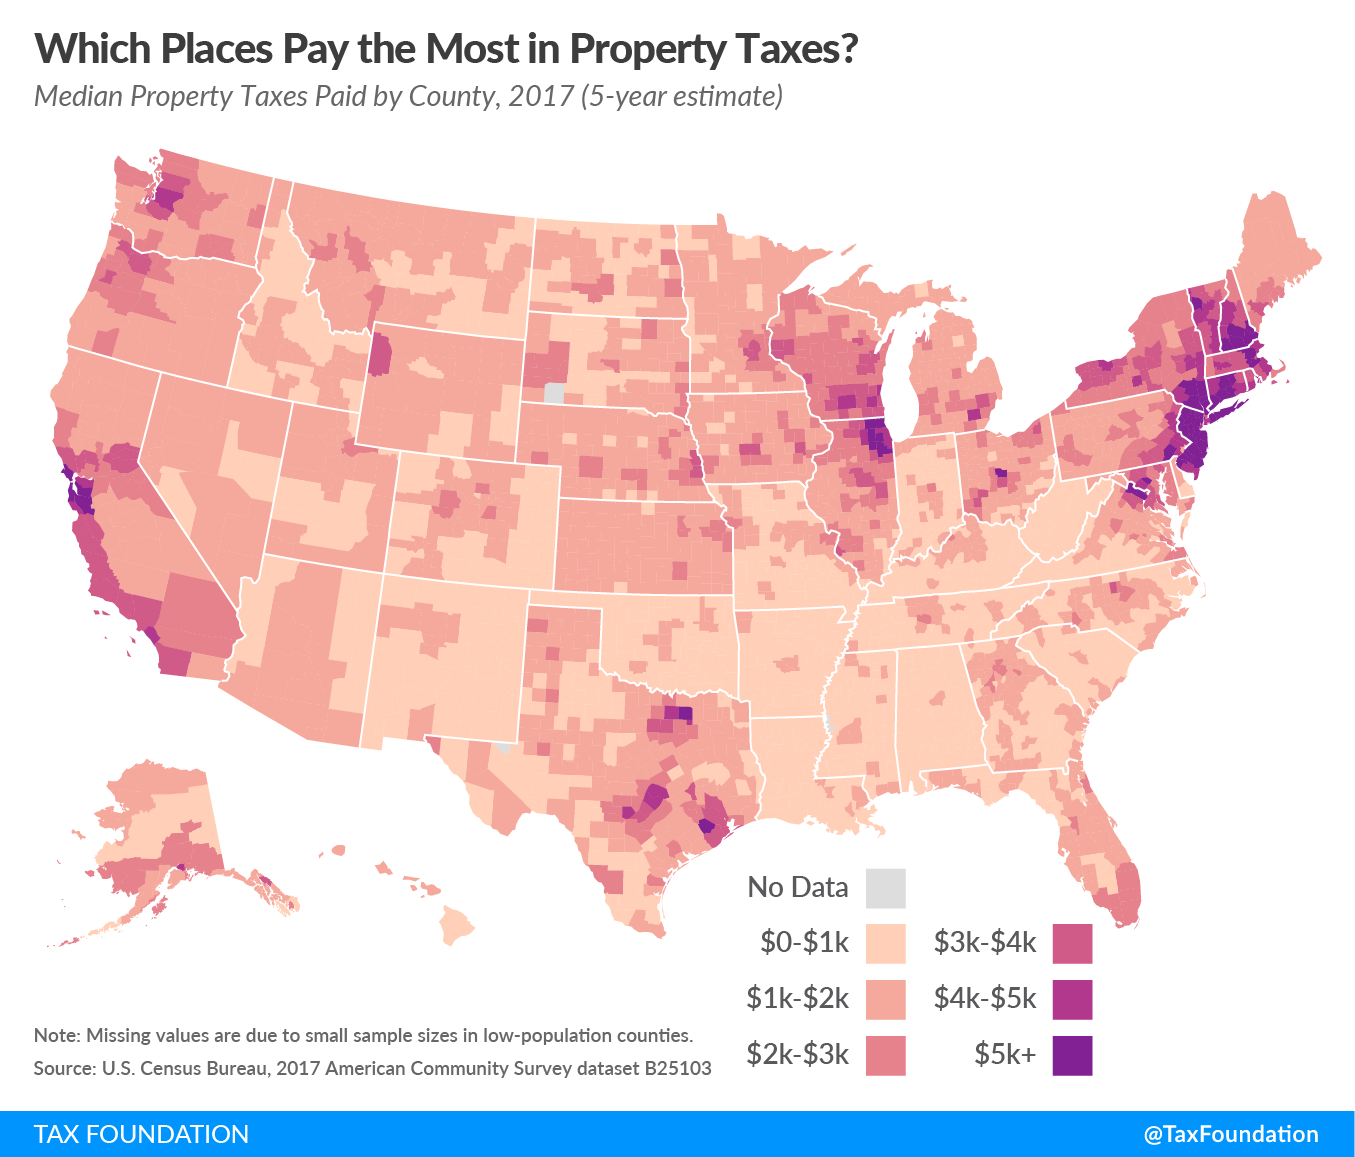
Property Taxes by County
Median property taxes paid vary widely across (and within) the 50 states. The average countywide amount of property taxes paid in 2023 across the United States was $1,889 (with a standard deviation of $1,426). The lowest property tax bills in the country are in 11 counties or county equivalents with median property taxes of less than $250 a year:
- Alabama: Lamar and Choctaw counties
- Alaska: Northwest Arctic Borough, the Kusilvak Census Area, and the Copper River Census Area*
- Louisiana: Allen, Avoyelles, Madison, Tensas, and West Carroll parishes
- South Dakota: Oglala Lakota County
(*Significant parts of Alaska have no property taxes, though most of these areas have such small populations that they are excluded from federal surveys.)
Additionally, two counties in Alabama (Bibb and Sumter), three parishes in Louisiana (Bienville, Catahoula, and East Carroll), and McDowell County in West Virginia all have median property taxes paid between $250 and $300.
The 16 counties with the highest median property tax payments all have bills exceeding $10,000:
- California: Marin County
- New Jersey: Bergen, Essex, Hunterdon, Monmouth, Morris, Passaic, Somerset, and Union counties
- New York: Nassau, New York, Putnam, Rockland, Suffolk, and Westchester counties
- Virginia: Falls Church City
All but Falls Church and Marin County are near New York City. Additionally, two counties in New Jersey (Hudson and Middlesex), three counties in California (San Francisco, San Mateo, and Santa Clara), and Western Connecticut Planning Region in Connecticut all have median property taxes paid above $9,000.
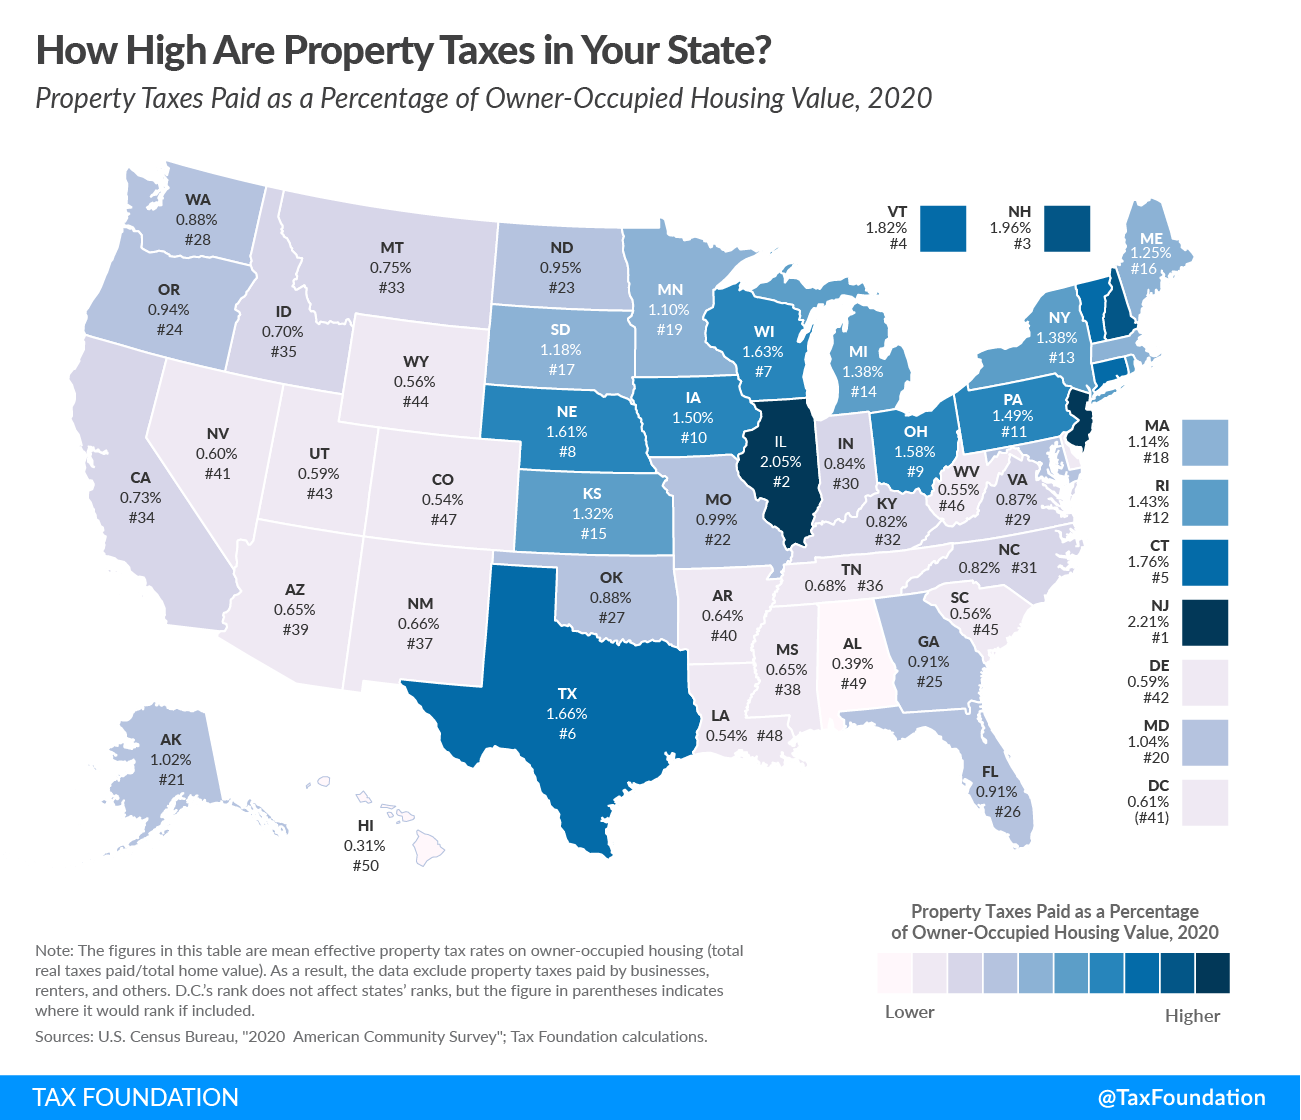
Property Taxes by State
Property tax payments also vary within states. In some states, typically those with low property tax burdens, this variation is not high. In Alabama, for instance, median property taxes range from below $200 in Choctaw County to $1,343 in Shelby County (part of the Birmingham–Hoover metropolitan area), with an average tax bill of $511. In Virginia, in contrast, median property taxes range from $404 in Buchanan County to more than $10,000 in Falls Church City (part of the Washington metropolitan area), with an average tax bill of $1,963.
Higher median payments tend to be concentrated in urban areas. Median property taxes paid in Manhattan (New York County), San Francisco, Chicago (Cook County), and Miami (Miami-Dade County) are two to three times higher than their state’s average. This is partially explained by the prevalence of above-average home prices in urban centers. Because property taxes are assessed as a percentage of home values, it follows that higher property taxes are paid in places with higher housing prices. However, because millages—the amount of tax per thousand dollars of value—can be adjusted to generate the necessary revenue from a given property tax base, the higher payments also reflect an overall higher cost of government—and commensurately higher taxes—in these areas. (More expensive homes might correlate with a higher cost of government services, but they don’t necessarily cause it. If homes in a community doubled in value but nothing else in the economy changed, local government wouldn’t necessarily need to capture twice as much revenue.)
Since home values vary significantly across counties, it is also important to compare effective tax burdens (the median property tax paid divided by the median value of owner-occupied housing units). The five counties with the highest burdens all have an effective property tax rate above 2.95 percent. These counties include Allegany and Orleans counties in New York, Camden and Salem counties in New Jersey, and Menominee County in Wisconsin. The five counties with the lowest burdens all have an effective property tax rate below 0.18 percent. They include the Copper River Census Area and Northwest Arctic Borough in Alaska, Choctaw County in Alabama, East Feliciana Parish in Louisiana, and Maui County in Hawaii.
Because the dollar value of property tax bills often fluctuates with housing prices, it can be difficult to use this measure to make comparisons between states. Further complicating matters, rates don’t mean the same thing from state to state, or even county to county, because the millage is often imposed only on a percentage of actual property value, as is discussed below. However, one way to compare is to look at effective tax rates on owner-occupied housing—the average amount of residential property taxes actually paid, expressed as a percentage of home value.
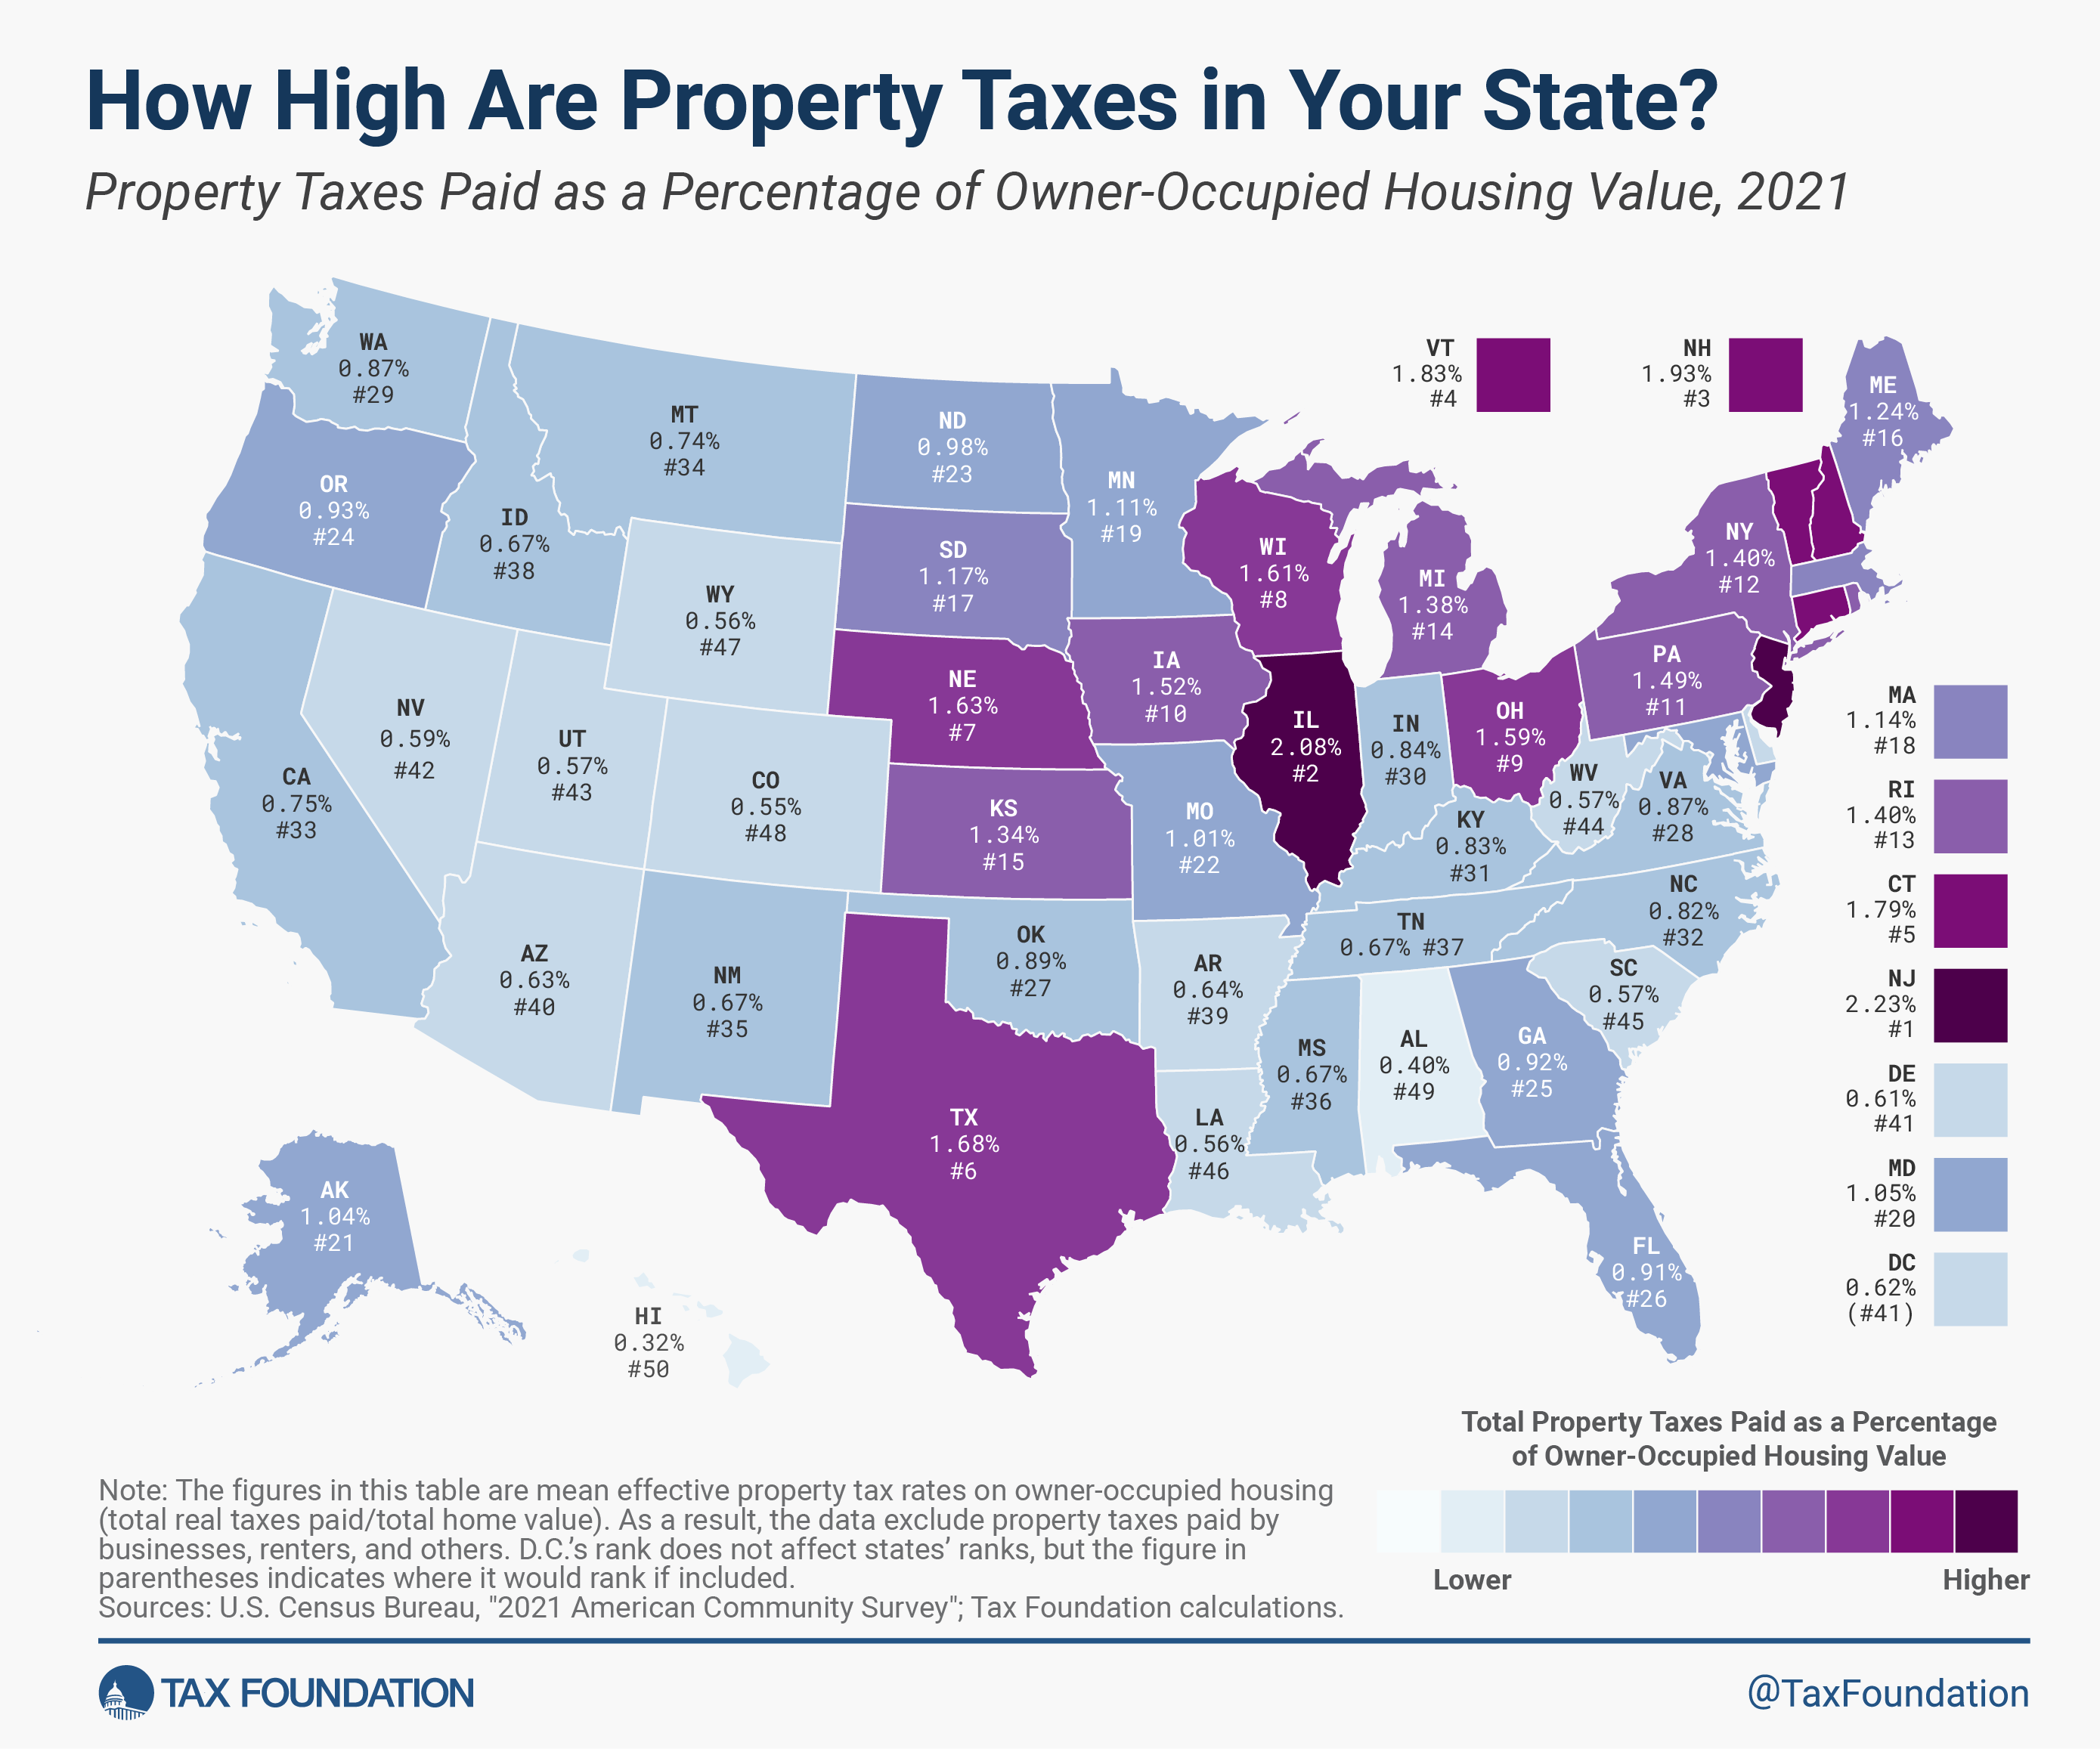
In calendar year 2023 (the most recent data available), New Jersey had the highest effective rate on owner-occupied property at 2.23 percent, followed by Illinois (2.07 percent) and Connecticut (1.92 percent). Hawaii was at the other end of the spectrum with the lowest effective rate of 0.27 percent, followed closely by Alabama (0.38 percent), Nevada (0.49 percent), Colorado (0.49 percent), and South Carolina (0.51 percent).
Diving Deeper
Governments tax real property in a variety of ways: some impose a millage on the fair market value of the property, while others impose it on a percentage (the assessment ratio) of the market value. While values are often determined by comparable sales, jurisdictions also vary in how they calculate assessed values. Property taxes tend to be imposed at the local level, although their basic framework is typically set by state law.
Some states have equalization requirements, ensuring uniformity across the state. Sometimes property tax limitations restrict the degree to which one’s property taxes can rise in a given year, and sometimes rate adjustments are mandated after assessments to ensure uniformity or revenue stability. Abatements (i.e., reductions or exemptions) are often available to certain taxpayers, like veterans or senior citizens. Also, residential property is frequently taxed at a lower level than commercial property—even though most states classify apartment complexes as commercial property, meaning that renters bear much of the economic incidence of higher property taxes than those imposed on homeowners. And of course, property tax rates are set not only by cities and counties, but also by school boards, fire departments, and utility commissions.
Stay informed on the tax policies impacting you.
Subscribe to get insights from our trusted experts delivered straight to your inbox.
Subscribe