New Marquette Law School Poll national survey finds approval of U.S. Supreme Court above 50% for first time since March 2022

Large majorities say president must follow Supreme Court decisions, Court can rule laws unconstitutional

Also:

  • Majority supports decision upholding law that could ban TikTok
  • With sharp partisan differences, majority say Trump should have received more of a penalty for felony conviction
  • Also with sharp partisan differences, majority oppose Court decision on immunity for some presidential acts
  • Majority support Texas law that would require use of IDs to access internet sex sites

Please note: Complete Poll results and methodology information can be found online at law.marquette.edu/poll

MILWAUKEE – A new Marquette Law School Poll national survey finds that 51% of adults approve of the job the U.S. Supreme Court is doing, while 49% disapprove. In December, approval was 48% and disapproval was 52%. This is the highest that Court approval has been since March 2022, when 54% approved, and follows an upward trend since May 2024.

The trend in approval since 2020 is shown in Figure 1 and Table 1. (All results in the tables are stated as percentages.)

graph showing the approval rating of the US Supreme Court over time

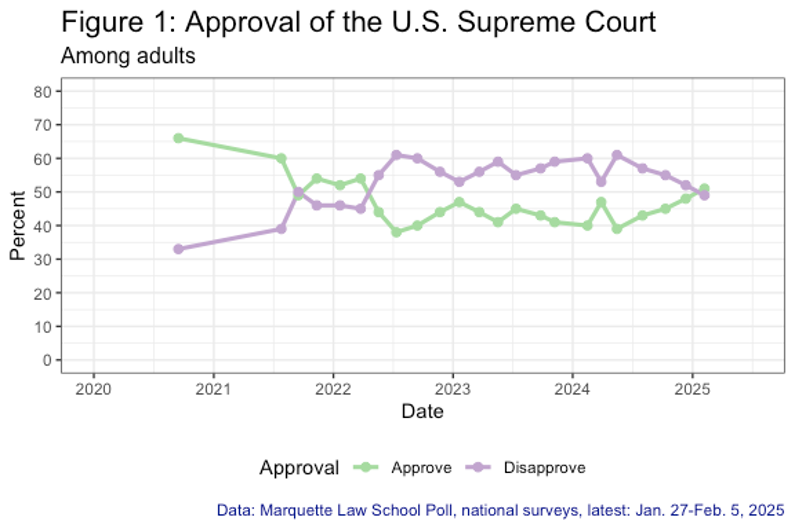
Table 1: U.S. Supreme Court approval

Among adults

Poll datesApproval
ApproveDisapprove
1/27-2/6/255149
12/2-11/244852
10/1-10/244555
7/24-8/1/244357
5/6-15/243961
3/18-28/244753
2/5-15/244060
11/2-7/234159
9/18-25/234357
7/7-12/234555
5/8-18/234159
3/13-22/234456
1/9-20/234753
11/15-22/224456
9/7-14/224060
7/5-12/223861
5/9-19/224455
3/14-24/225445
1/10-21/225246
11/1-10/215446
9/7-16/214950
7/16-26/216039
9/8-15/206633
Marquette Law School Poll, national surveys, latest: Jan. 27-Feb. 5, 2025
Question: Overall, how much do you approve or disapprove of the way the U.S. Supreme Court is handling its job?

The latest Marquette Law School Poll’s national Supreme Court survey was conducted Jan. 27-Feb. 5, 2025. The survey interviewed 1,018 adults nationwide and has a margin of error of +/-3.5 percentage points.

Conflict between Supreme Court, President, and Congress

The public believes that the Supreme Court has substantial power in relation to the president and Congress. In a case of the Court ruling against the president, 83% say a president is required to follow the Court’s ruling, while 17% say the president has the power to ignore the Court’s ruling. This opinion has been relatively stable since 2019, as shown in Table 2.

Table 2: Can a president ignore Supreme Court ruling

Among adults

Poll datesIgnore or follow ruling
The president has the power to ignore the rulingThe president is required to do as the ruling says
1/27-2/6/251783
12/2-11/242179
9/8-15/201682
9/3-13/192276
Marquette Law School Poll, national surveys, latest: Jan. 27-Feb. 5, 2025
Question: If the Supreme Court rules against the president in a case, does the president have the power to ignore that ruling, or is the president required to do as the ruling says?

While large majorities of all partisan groups think the president must obey Supreme Court rulings, 23% of Republicans say the president can ignore a Court ruling, as compared to 18% of independents and 11% of Democrats, as shown in Table 3.

Table 3: Can a president ignore Supreme Court ruling, by party identification

Among adults

Party IDIgnore or follow ruling
The president has the power to ignore the rulingThe president is required to do as the ruling says
Total1783
Republican2377
Independent1882
Democrat1189
Marquette Law School Poll, national survey, Jan. 27-Feb. 5, 2025
Question: If the Supreme Court rules against the president in a case, does the president have the power to ignore that ruling, or is the president required to do as the ruling says?

An even larger majority, 87%, say the Supreme Court has the power to review laws passed by Congress and to declare them invalid if they conflict with the Constitution, while 13% say the Court lacks this power. This has also been quite stable since 2019, as shown in Table 4.

Table 4: Can Court review laws

Among adults

Poll datesCan review laws
Yes, the Supreme Court has this powerNo, the Supreme Court does not have this power
1/27-2/6/258713
12/2-11/248316
9/7-16/218614
9/8-15/208713
9/3-13/198514
Marquette Law School Poll, national surveys, latest: Jan. 27-Feb. 5, 2025
Question: Does the Supreme Court have the power to review laws passed by Congress and to declare them invalid if they conflict with the Constitution?

All partisan groups are in close agreement on this power of judicial review of laws passed by Congress, as shown in Table 5.

Table 5: Can Court review laws by party identification

Among adults

Party IDJudicial review
Yes, the Supreme Court has this powerNo, the Supreme Court does not have this power
Total8713
Republican8713
Independent8614
Democrat8614
Marquette Law School Poll, national survey, Jan. 27-Feb. 5, 2025
Question: Does the Supreme Court have the power to review laws passed by Congress and to declare them invalid if they conflict with the Constitution?

Recent Supreme Court cases

Last month, in January, the Supreme Court upheld the 2024 federal law requiring that the Chinese-owned social media app TikTok be sold or banned in the United States. A substantial majority of adults, 62%, favor this decision, while 38% are opposed. President Donald Trump has delayed enforcement of the law, which was to take effect Jan. 19, the day before his inauguration.

Republicans are much more supportive of the Court’s decision upholding the law requiring the sale or banning of TikTok than are independents or Democrats. This is despite bipartisan support of the bill in Congress and the fact that former President Joe Biden signed the bill into law. Almost three-quarters of Republicans, 73%, favor the Court’s decision, compared to 53% of independents and 54% of Democrats. These results are shown in Table 6.

Table 6: Favor or oppose Court decision upholding TikTok law

Among adults

Party IDUphold TikTok ban law
FavorOppose
Among all adults6238
Republican7327
Independent5347
Democrat5446
Marquette Law School Poll, national surveys, latest: Jan. 27-Feb. 5, 2025
Question: In January, the Supreme Court upheld a law requiring the social media app TikTok, which is owned by a Chinese company, to be sold or banned in the U.S. How much do you favor or oppose this decision?

In this survey, 14% of adults say they use TikTok several times a day, 8% use it several times a week, and 10% use it a few times a month. Some 15% say they used TikTok in the past but have stopped, and 53% have never used it.

Those who make the most use of TikTok are most opposed to the Court’s ruling, while those who have never used the app are most in favor of the Court’s decision. Support for the ruling rises as frequency of use declines, as shown in Table 7.

Table 7: Favor or oppose Court upholding TikTok law, by use of TikTok

Among adults

 Uphold TikTok ban law
Use of TikTokFavorOppose
Among all adults6238
Several times a day1882
Several times a week3169
A few times a month6139
Used in the past but not now6040
Never7921
Marquette Law School Poll, national surveys, latest: Jan. 27-Feb. 5, 2025
Question: In January the Supreme Court upheld a law requiring the social media app TikTok, which is owned by a Chinese company, to be sold or banned in the U.S. How much do you favor or oppose this decision?
Question: How often, if ever, do you use the TikTok app?

A majority, 65%, favor the Supreme Court’s January decision to allow Trump’s sentencing in his felony conviction in a New York court, which had denied his bid to delay sentencing.

A majority of Republicans, 57%, oppose the Court’s allowing sentencing to proceed, and 43% were in favor of the decision. A large majority, 70%, of independents favored the Court’s allowing sentencing, as did an even larger majority of Democrats, 87%. These results are shown in Table 8.

Table 8: Favor or oppose Court’s allowing Trump sentencing

Among adults

Party IDAllow Trump sentencing
FavorOpposeSkipped/Ref
Among all adults65350
Republican43570
Independent70300
Democrat87120
Marquette Law School Poll, national surveys, latest: Jan. 27-Feb. 5, 2025
Question: In January the Supreme Court rejected Donald Trump’s request to halt his criminal sentencing in New York where he was convicted in May on 34 felony counts, allowing sentencing to proceed. How much do you favor or oppose this decision?

Following the Court’s ruling, on Jan. 10, a New York judge gave Trump a sentence of “unconditional discharge,” which included neither jail time nor any other penalties. A minority of adults, 44%, say this was an appropriate sentence, while 55% say Trump should have been given a greater penalty. A large majority of Republicans, 83%, say this was an appropriate sentence, while 69% of independents and 90% of Democrats say there should have been a greater penalty, as shown in Table 9.

Table 9: Was Trump’s sentence appropriate or should there have been a greater penalty

Among adults

Party IDAppropriate sentence?
Appropriate sentenceShould have been a greater penalty
Among all adults4455
Republican8317
Independent3169
Democrat1090
Marquette Law School Poll, national surveys, latest: Jan. 27-Feb. 5, 2025
Question: On January 10th, the judge in Trump’s New York felony conviction case gave Trump a sentence of unconditional discharge, which includes neither jail time nor any other penalties. Do you think this is an appropriate sentence or should there have been a greater penalty?

In January the Supreme Court heard arguments concerning a Texas law requiring adults to prove they are over 18 in order to access sexually oriented internet sites. The law aims to limit access to minors by requiring that a user provide a government-issued ID to prove age. Arguments against the law claimed that it impinges on the rights of adults. The case is expected to be decided by the end of June.

Among adults, 69% say the Court should uphold the law, while 31% say the law should be struck down. Republicans are most in favor of upholding the law, 78%, with independents nearly as supportive at 74%, while Democrats support the law the least at 57%, as shown in Table 10.

Table 10: Should Court uphold law requiring ID to access sexually-oriented internet sites

Among adults

Party IDUphold law?
Uphold the lawStrike it down
Among all adults6931
Republican7822
Independent7426
Democrat5743
Marquette Law School Poll, national surveys, latest: Jan. 27-Feb. 5, 2025
Question: In January the Supreme Court heard arguments concerning a Texas law meant to prevent minors from accessing sexual materials on the internet, through a requirement that adults prove they are 18 or over by submitting government-issued IDs in order to access sexually oriented websites. Do you think the court should uphold this law or strike it down for infringing on the rights of adults?

A majority, 61%, of the public oppose the 2024 Court decision that found presidents have broad immunity from prosecution for official acts as president, while 39% favor that decision. Opinion on this has changed little since July 2024, immediately after the ruling, as shown in Table 11.

Table 11: Favor or oppose ruling on presidential immunity

Among adults

 Immunity ruling
Poll datesFavorOppose
1/27-2/6/253961
12/2-11/243862
10/1-10/243961
7/24-8/1/244159
Marquette Law School Poll, national surveys, latest: Jan. 27-Feb. 5, 2025
Question: In July 2024, the U.S. Supreme Court ruled that, while there is no immunity for unofficial acts, former presidents have broad immunity from criminal prosecution for official acts as president. How much do you favor or oppose this decision?

More than two-thirds of Republicans, 68%, favor the holding that presidents are immune for official acts, but 69% of independents and 87% of Democrats are opposed to the decision, as shown in Table 12.

Table 12: Favor or oppose ruling on presidential immunity, by party identification

Among adults

Party IDImmunity ruling
FavorOppose
Among all adults3961
Republican6832
Independent3169
Democrat1387
Marquette Law School Poll, national surveys, latest: Jan. 27-Feb. 5, 2025
Question: In July 2024, the U.S. Supreme Court ruled that, while there is no immunity for unofficial acts, former presidents have broad immunity from criminal prosecution for official acts as president. How much do you favor or oppose this decision?

Opinion of the Court’s decision in 2022 to overturn Roe v. Wade, the 1973 decision that made abortion legal nationwide, has varied only slightly since the decision. In February, 38% favor the decision and 62% oppose it. In November 2022, 33% favored and 66% opposed overturning Roe v. Wade. The full trend is shown in Table 13.

Table 13: Favor or oppose ruling overturning Roe v. Wade

Among adults

 Overturn Roe v. Wade
Poll datesFavorOppose
1/27-2/6/253862
12/2-11/243763
10/1-10/243763
7/24-8/1/243367
2/5-15/243367
11/2-7/233565
9/18-25/233664
7/7-12/233862
5/8-18/233565
3/13-22/233367
1/9-20/233564
11/15-22/223366
Marquette Law School Poll, national surveys, latest: Jan. 27-Feb. 5, 2025
Question: In 2022, the Supreme Court overturned Roe versus Wade, thus striking down the 1973 decision that made abortion legal in all 50 states. How much do you favor or oppose this decision?

Partisan divisions remain strong on the abortion ruling, with 65% of Republicans in favor of overturning Roe v. Wade, while only 36% of independents and 9% of Democrats hold this opinion, as shown in Table 14. These partisan divisions have changed little since 2022.

Table 14: Favor or oppose ruling overturning Roe v. Wade, by party identification

Among adults

Party IDOverturn Roe v. Wade
FavorOppose
Among all adults3862
Republican6535
Independent3664
Democrat991
Marquette Law School Poll, national surveys, latest: Jan. 27-Feb. 5, 2025
Question: In 2022, the Supreme Court overturned Roe versus Wade, thus striking down the 1973 decision that made abortion legal in all 50 states. How much do you favor or oppose this decision?

Views of the Court

In Marquette Law School polling in 2019-2021, more than 60% of adults said the Supreme Court justices’ decisions were motivated mainly by the law, and fewer than 40% said the motivation was mainly politics. In early 2022, this began to shift, and since July 2023 slightly more than half have said the motivation is mainly politics. In this newest (February) survey, 54% say politics is the main motivation for justices and 46% say it is mainly the law. The full trend is shown in Table 15.

Table 15: Decisions motivated by law or by politics

Among adults

 Motivation of decisions
Poll datesMainly politicsMainly the law
1/27-2/6/255446
12/2-11/245248
10/1-10/245545
7/24-8/1/245743
5/6-15/245644
3/18-28/245050
2/5-15/245446
11/2-7/235545
9/18-25/235248
7/7-12/235842
1/9-20/234951
7/5-12/225248
1/10-21/224753
11/1-10/213070
9/7-16/213961
7/16-26/212971
9/8-15/203762
9/3-13/193564
Marquette Law School Poll, national surveys, latest: Jan. 27-Feb. 5, 2025
Question: In general, what most often motivates Supreme Court justices’ decisions?

In 2019, both Republicans and Democrats agreed that decisions were based mainly on the law, with 66% of Republicans and 65% of Democrats saying mainly the law, as did 55% of independents. In the current poll, 63% of Republicans say mainly the law, while only 32% of Democrats and 39% of independents say mainly the law.

The Court has had a majority of justices appointed by Republican presidents for 54 years, since 1970 (with the exception of a 14-month vacancy in 2016-17 which created a 4-4 tie), and the current Court has six justices appointed by Republicans and three appointed by Democrats. A persistent minority of the public has continued to say a majority of justices were definitely or probably appointed by Democratic presidents, but that percentage has declined from the mid-to-upper 20% range to the upper teens now. Likewise, the percentage saying the Court definitely has a majority appointed by Republican presidents has doubled from 19% in September 2019 to 40% in February 2025. This trend is shown in Table 16.

Table 16: Majority of Court appointed by which party’s presidents

Among adults

Poll datesMajority appointed by
Definitely/Probably Dem majorityProbably Rep majorityDefinitely Rep majority
1/27-2/6/25184240
12/2-11/24214137
10/1-10/24224335
7/24-8/1/24244135
5/6-15/24284033
3/18-28/24254332
2/5-15/24293833
11/2-7/23264330
9/18-25/23264232
7/7-12/23224236
5/8-18/23294130
3/13-22/23274131
1/9-20/23234136
11/15-22/22244035
9/7-14/22224037
7/5-12/22204040
5/9-19/22313931
3/14-24/22284724
1/10-21/22234433
11/1-10/21284428
9/7-16/21254629
7/16-26/21244530
9/8-15/20285121
9/3-13/19275319
Marquette Law School Poll, national surveys, latest: Jan. 27-Feb. 5, 2025
Question: What is your guess as to whether a majority of the current U.S. Supreme Court justices were appointed by Democratic or Republican presidents?

Confidence in institutions

Confidence in several institutions is summarized in Table 17.

Confidence in the presidency increased from 25% with a great deal or a lot of confidence in December to 34% with that much confidence in February. However, those with little or no confidence also increased, from 41% in December to 46% in February.

Not surprisingly this shift was strongly related to partisan feelings about the presidency and the change in administration. In December, 27% of Republicans had a great deal or a lot of confidence in the presidency, while 68% did in February. Democratic confidence moved in the opposite direction, from 25% with high confidence in December to 6% in February. In contrast, high confidence among independents barely moved, from 17% in December to 16% in February.

The Supreme Court has the second highest “great deal/a lot of” confidence rating, after the presidency, with the FBI just 1 percentage point behind. The Department of Justice trails these by 7 percentage points, and also has a higher percentage saying they have little or no confidence.

Congress and the national news media are well below the other institutions in public confidence, with fewer than 15% expressing high confidence for either.

Table 17: Confidence in institutions

Among adults

InstitutionConfidence
Great deal/a lotSomeLittle/None
The presidency342046
U.S. Supreme Court303733
The FBI294230
The U.S. Department of Justice224136
Congress144343
National news media122959
Marquette Law School Poll, national survey, Jan. 27-Feb. 5, 2025
Question: Here is a list of institutions in American society. How much confidence do you have in each one?

About the Marquette Law School Poll

The survey was conducted Jan. 27-Feb. 5, 2025, interviewing 1,018 adults nationwide, with a margin of error of +/-3.5 percentage points. Interviews were conducted using the SSRS Opinion Panel, a national probability sample with interviews conducted online. The detailed methodology statement, survey instrument, topline results, and crosstabs for this release are available on the Marquette Law Poll website. Some items from this survey, concerning political topics, were released on Feb. 12.

Wording of questions about recent and past Supreme Court decisions: These items do not attempt to exactly frame the particular issues in specific cases but rather address the topic in more general terms.

4

The wording of questions about recent decisions includes:

TikTok v. Garland

  • In January, the Supreme Court upheld a law requiring the social media app TikTok, which is owned by a Chinese company, to be sold or banned in the U.S. How much do you favor or oppose this decision?

Trump v. New York

  • In January, the Supreme Court rejected Donald Trump’s request to halt his criminal sentencing in New York where he was convicted in May on 34 felony counts, allowing sentencing to proceed. How much do you favor or oppose this decision?

Free Speech Coalition v. Paxton

  • In January the Supreme Court heard arguments concerning a Texas law meant to prevent minors from accessing sexual materials on the internet, through a requirement that adults prove they are 18 or over by submitting government-issued IDs in order to access sexually oriented websites. Do you think the court should uphold this law or strike it down for infringing on the rights of adults?

Trump v. United States

  • In July, the U.S. Supreme Court ruled that, while there is no immunity for unofficial acts, former presidents have broad immunity from criminal prosecution for official acts as president. How much do you favor or oppose this decision?

Dobbs v. Jackson Women’s Health Organization

  • In 2022, the Supreme Court overturned Roe versus Wade, thus striking down the 1973 decision that made abortion legal in all 50 states. How much do you favor or oppose this decision?

New Marquette Law School Poll national survey finds public strongly favors some Trump policies, strongly opposes others

Recognizing only two sexes and immigrant orders are most popular, “Gulf of America” naming and Jan. 6 pardons least popular

Other highlights:

  • Overall opinion is skeptical on tariffs
  • Majorities doubt Trump will reduce inflation
  • Polarized views by party remain very strong
  • Opinion shifts toward increased optimism on the nation’s direction

MILWAUKEE – A new Marquette Law School Poll national survey finds substantial majorities support some of President Donald Trump’s early initiatives, while equally substantial majorities oppose others of his policies.

Here are Trump’s executive orders, among those covered in the poll, garnering favorable support:

  • The federal government’s recognizing only two sexes, male and female, is supported by 63% and opposed by 37%.
  • Asked about deporting immigrants in the United States illegally, 60% are in favor and 40% are opposed.
  • Similarly, 60% favor expanding oil and gas production.
  • And 59% favor declaring a national emergency due to migrant crossings at the southern border.

Conversely, here are executive orders with majority unfavorability:

  • A majority, 57%, oppose deporting immigrants who have been in the in the United States illegally for a number of years, have jobs, and no criminal record, while 43% favor deportation in this circumstance.
  • A larger majority, 65%, oppose Trump’s announcement in his inaugural address that the United States will take back the Panama Canal, while 35% favor this.
  • The pardon of all January 6 defendants is opposed by 65% and favored by 34%.
  • Renaming the Gulf of Mexico as the Gulf of America is opposed by 71% and favored by 29%.

These results are shown in Figure 1 and Table 1.

graph showing the share of adults favoring or opposing various Trump policies

Table 1: Favor or oppose Trump policies

Among adults

 Favor or oppose
PolicyFavorOppose
Recognize only male and female sexes6337
Deport immigrants in U.S. illegally6040
Expand oil and gas production6040
Declare emergency on southern border5941
Deport immigrants in U.S. illegally, including without criminal record4357
Take back the Panama Canal3565
Pardon January 6 defendants3465
Rename Gulf of Mexico2971
Marquette Law School Poll, national survey, Jan. 27-Feb. 5, 2025
Question: See full text of questions at end of this release

Partisan differences are large, with a majority of Republicans supporting all the Trump policies, a majority of Democrats opposed to each policy, and majorities of independents supporting some policies while opposing others.

The survey was conducted Jan. 27-Feb. 5, 2025, interviewing 1,018 adults nationwide, with a margin of error of +/-3.5 percentage points.

More than 90% of Republicans favor Trump’s most popular actions: those on recognizing two sexes, deporting immigrants in the United States illegally, expanding oil and gas production, and declaring an emergency on the border. A substantial majority of independents, 66%, favor recognizing two sexes, while slight majorities of independents favor deporting immigrants (51%), expanding oil and gas production (55%), and declaring a border emergency (51%). Among Democrats, substantial majorities oppose each of these policies, although more than a quarter of Democrats variously support these initiatives by Trump.

Of the four policies that face majority opposition among all adults, between 57% and 68% of Republicans support Trump’s positions. Among Republicans, 67% favor deportations of immigrants including those with no criminal record, 63% support taking back the Panama Canal, 68% favor pardons for Jan. 6 defendants, and 57% favor renaming the Gulf of Mexico.

Among independents, majorities oppose all four of these policies, with 69% opposed to deporting immigrants in the United States illegally who have jobs and no criminal record, 71% opposed to taking back the Panama Canal, 76% opposed to pardons for Jan. 6 defendants, and 82% opposed to renaming the Gulf of Mexico.

Among Democrats, 78% oppose deporting immigrants with no criminal record, though nearly a quarter, 22%, support this. For the other three unpopular proposals, more than 90% of Democrats are opposed, with 94% opposed to taking back the Panama Canal, 96% opposed to pardons for Jan. 6 defendants, and 96% opposed to renaming the Gulf of Mexico.

These results are shown in Figure 2 and Table 2.

graph showing the share of republicans, democrats, and independents favoring Trump policies

Table 2: Favor Trump policies, by party ID

Among adults

PolicyTotal favorRepublicanIndependentDemocrat
Recognize only male and female sexes63946627
Deport immigrants in U.S. illegally60935129
Expand oil and gas production60925527
Declare emergency on southern border59905129
Deport immigrants in U.S. illegally, including without criminal record43673122
Take back the Panama Canal3563296
Pardon January 6 defendants3468224
Rename Gulf of Mexico2957164
Marquette Law School Poll, national survey, Jan. 27-Feb. 5, 2025
Question: See full text of questions at end of this release

The public is somewhat skeptical of tariffs, with 24% who say tariffs will help the U.S. economy and 46% who say tariffs will hurt the economy. There is substantial uncertainty on this question, with 13% saying tariffs won’t have much effect and another 17% who say they don’t know.

Almost half of Republicans (49%) think tariffs will help, while 16% think they will hurt. The rest see no effect or say they don’t know. Independents are much more skeptical of tariffs, with 12% saying they help the economy, 45% saying they hurt the economy, and a large 44% who say they make no difference or who don’t know. A large majority of Democrats (80%) think tariffs hurt the economy, and only 4% who think they help the economy. Uncertainty about tariffs is smaller among Democrats than among independents or Republicans, with 16% saying tariffs have no effect or they don’t know. These results are shown in Table 3.

Table 3: Effect of tariffs on the economy, by party identification

Among adults

Party IDEffect of tariffs
Helps U.S. economyHurts U.S. economyDoesn’t make much differenceDon’t know
Among all adults24461317
Republican49161618
Independent12451727
Democrat48079
Marquette Law School Poll, national survey, Jan. 27-Feb. 5, 2025
Question: In general, do you think imposing tariffs or fees on products imported from other countries helps the U.S. economy, hurts the economy, or doesn’t make much of a difference either way?

Among all adults, nearly half (49%) think Trump’s policy proposals will increase inflation, while 36% think his policies will decrease inflation and 15% say they won’t affect inflation. Seventy percent of Republicans are confident Trump’s policies will decrease inflation, a view shared by only 26% of independents and 5% of Democrats. These results are shown in Table 4.

Table 4: Effect of Trump policies on inflation, by party identification

Among adults

Party IDEffect on inflation
Decrease inflationIncrease inflationHave no effect on inflation
Among all adults364915
Republican701613
Independent264726
Democrat58510
Marquette Law School Poll, national survey, Jan. 27-Feb. 5, 2025
Question: Do you think Trump’s policy proposals will decrease inflation, increase inflation, or have no effect on inflation?

A sizable majority of adults (60%) support the law passed in 2024 that requires the Chinese-owned social media app TikTok to be sold or banned, with 40% opposing the sale or ban. Trump has halted enforcement of the law for a period of time while a resolution of the issue is sought.

Among Republicans, a large majority (72%) support the law requiring sale of TikTok, while 54% of independents and 49% of Democrats support the required sale. These results are shown in Table 5.

Table 5: TikTok sale or ban, by party identification

Among adults

Party IDTikTok position
Require saleContinue to be available
Among all adults6040
Republican7228
Independent5446
Democrat4951
Marquette Law School Poll, national survey, Jan. 27-Feb. 5, 2025
Question: About 170 million Americans use the TikTok app but Congress passed a law requiring it to be sold or banned because it is owned by a Chinese company that could potentially provide the Chinese government with sensitive information about Americans. Do you think these national security concerns are important enough to require the sale or banning of TikTok or do you think Americans should continue to be able to use the app?

Those who are frequent users of TikTok, saying they use it several times a day or several times a week, are most opposed to the sale or ban of the app, with 80% opposed to the sale or banning and 20% favoring the requirement. Among those who only use the app occasionally or who have used it but have stopped, 58% support the law while 42% say Tik Tok should remain available. Those who have never used TikTok are most in favor of the law, 77%, with 23% saying it should remain available. These results are shown in Table 6.

Table 6: TikTok sale or ban, by use of the app

Among adults

TikTok useTikTok position
Require saleContinue to be available
Among all adults6040
Frequent user2080
Occasional or past user5842
Never used7723
Marquette Law School Poll, national survey, Jan. 27-Feb. 5, 2025
Question: About 170 million Americans use the TikTok app but Congress passed a law requiring it to be sold or banned because it is owned by a Chinese company that could potentially provide the Chinese government with sensitive information about Americans. Do you think these national security concerns are important enough to require the sale or banning of TikTok or do you think Americans should continue to be able to use the app?
Question: How often, if ever, do you use the TikTok app?

Younger people are more likely to be frequent users of TikTok. Among those 18-29 years old, 38% report frequent use of TikTok. That rate falls to 29% among those 30-44 and to 19% among 45-59-year-olds. Of those 60 or over, just 9% report frequent use of TikTok.

In line with the relationship between age and use of TikTok, younger people are also more likely to say TikTok should remain available, while older people are more likely to support the law requiring sale or banning of the app. These results are shown in Table 7.

Table 7: TikTok sale or ban, by age

Among adults

AgeTikTok position
Require saleContinue to be available
Among all adults6040
18-294456
30-444951
45-596139
60+7822
Marquette Law School Poll, national survey, Jan. 27-Feb. 5, 2025
Question: About 170 million Americans use the TikTok app but Congress passed a law requiring it to be sold or banned because it is owned by a Chinese company that could potentially provide the Chinese government with sensitive information about Americans. Do you think these national security concerns are important enough to require the sale or banning of TikTok or do you think Americans should continue to be able to use the app?

Attention to news

In the weeks following Trump’s inauguration, 70% of people nationwide say they have heard or read a lot about plans to deport immigrants in the United States illegally. Fewer (53%) say they have heard or read a lot about plans to reduce the size of government, and 49% say they have read or heard a lot about Trump’s cabinet nominees. Thirty-nine percent say they heard or read a lot about Trump’s inaugural address. These results are shown in Table 8.

Table 8: Attention to news topics

Among adults

TopicHeard or read
A lotA littleNothing at all
Deportation of immigrants in U.S. illegally70264
Plans to reduce the size of government533512
Choices for cabinet positions494011
President Trump’s inaugural address394516
Marquette Law School Poll, national survey, Jan. 27-Feb. 5, 2025
Question: Here are some recent topics in the news. How much have you heard or read about each of these?

Likes and dislikes about Donald Trump

The survey asked people to say in their own words what they like or dislike about Donald Trump. The full set of responses is posted online.

Political divisions are apparent in the open-ended responses. Many people give only a positive view of Trump, and others give only a negative view of him. A pair of responses illustrate this category:

Likes: “Everything.” Dislikes: “Nothing.”

While, for another respondent:

Likes: “Nothing.” Dislikes: “He is disgusting.”

Of all respondents, 14% had only a positive comment about Trump and 36% had only a negative comment.

Those with mixed feelings, about 47% of respondents, provide greater insight into Trump’s strengths and weaknesses.

  • One respondent, an 80-year-old white male, said, “Promises made, promises kept. Tired of politicians who lie to your face to get elected and then just feather there (sic) own nest.” But the same person said, “Tone down the rhetoric and don’t be so crude.”
  • Comments about Trump’s verbal style are common, even among those who have positive things to say about him. In another example, a 24-year-old white male said he liked “the fact that he declared that there’s only 2 genders.” He added, “I like his policy on immigration. I also like his implementation of tariffs to encourage more things being produced in America.” But he also said, “He doesn’t think before he speaks some of the times.”
  • A 45-year-old male who did not report his race said, “He does what he campaigned he would do and he doesn’t care what his opponents think.” But he also said, “He treats people as disposable objects at times and how he communicates can be harsh when it does not need to be.”
  • Strong leadership was a common theme in the comments, but sometimes it was paired with substantive disagreement. A 65-year-old white male said he likes Trump’s “strong leadership.” He added, “I like that he is trying to make the US stronger.” The man also noted, “He is only concerned about Trump. Top/bottom leader with a huge ego. Very disappointed that he paroled the Jan. 6 people.”
  • On immigration, some see both positive and negative aspects of the issue. A 47-year-old Black female respondent said she likes “how he is trying to fix the immigration,” but “the way he going about it is wrong by snatching them all, even if they are working and have no record with the police.”
  • Elon Musk’s position in the administration was noted by a 50-year-old multiracial male who said, “I like that he’s fulfilling campaign promises, that his cabinet picks are not payback positions . . . I like that he ended the Madness of multiple Genders . . . I dislike the decision to allow unelected Elon Musk so much involvement in government.”
  • A 63-year-old white female mentioned she dislikes “when he allows private citizen Elon Musk into secure systems, thereby endangering American citizens. There are no more guardrails.”
  • A 58-year-old white male respondent is positive about Trump. He said, “He has common sense. He’s always the smartest guy in the room. He is results oriented. He doesn’t need to be liked or told what to do. He’s NOT Joe Biden. He treats the media with the disdain they deserve. He speaks for the common man.”
  • One respondent gave a mixed opinion on Trump: “His hiring choices in the first term were dreadful because of the advice he had been given,” he said. “Sometimes he needs to be more succinct, but he is by far the most effective political communicator in my lifetime.”

Approval and favorability

Trump starts his second term with 48% saying they approve of the job he is doing as president and 52% saying they disapprove. When asked in the Marquette Law School Poll in September 2020, near the end of Trump’s first term, 41% approved and 58% disapproved. In the new poll, as in the past, approval is closely related to partisanship, with 89% of Republicans approving of Trump, a view shared by 37% of independents and 9% of Democrats, as shown in Table 9.

Table 9: Trump approval, by party identification

Among adults

Party IDApproval
ApproveDisapprove
Among all adults4852
Republican8911
Independent3763
Democrat991
Marquette Law School Poll, national survey, Jan. 27-Feb. 5, 2025
Question: Overall, how much do you approve or disapprove of the way Donald Trump is handling his job as president?

Approval of how Trump has handled his cabinet selections is virtually identical to his overall approval, with 47% approving and 52% disapproving.

Opinion of four cabinet nominees shows a range of favorability and relatively low familiarity with the choices.

  • Secretary of State Marco Rubio is seen favorably by 43% and unfavorably by 31%, with 26% who haven’t heard enough to have an opinion.
  • Health and Human Services nominee Robert F. Kennedy Jr. is viewed favorably by 39% and unfavorably by 46%, while 14% haven’t heard enough about him.
  • Defense Secretary Pete Hegseth has a 28% favorable rating and a 37% unfavorable rating, while 35% say they haven’t heard enough.
  • The least well-known nominee in this survey is Attorney General Pam Bondi, with 29% favorable, 28% unfavorable, and 43% who don’t know enough about her.

These numbers have changed little since December, shortly after these nominations were announced. Rubio’s net favorability increased slightly since December, while Kennedy’s declined. Hegseth and Bondi were virtually unchanged. These results are shown in Table 10.

Table 10: Favorability of cabinet nominees

Among adults

Favorability
Poll datesNet favorableFavorableUnfavorableHaven’t heard enough
Marco Rubio
1/27-2/6/2512433126
12/2-11/243393625
Robert F. Kennedy, Jr.
1/27-2/6/25-7394614
12/2-11/240444411
Pete Hegseth
1/27-2/6/25-9283735
12/2-11/24-10273737
Pam Bondi
1/27-2/6/251292843
12/2-11/24-3283141
Marquette Law School Poll, national survey, Jan. 27-Feb. 5, 2025
Question: Do you have a favorable or an unfavorable opinion of the following people or haven’t you heard enough yet to have an opinion?

Trump’s overall favorable rating stands at 44%, with 54% unfavorable. This is a small decline since December when he was seen favorably by 49% and unfavorably by 50%. Trump’s favorability has recovered from his low point of 32% favorable and 67% unfavorable in January 2022. The full trend for Trump’s favorability is shown in Table 11.

Table 11: Trump favorability trend

Among adults

Poll datesFavorability
NetFavorableUnfavorableHaven’t heard enough
1/27-2/6/25-1044542
12/2-11/24-149501
10/1-10/24-1144551
7/24-8/1/24-646522
5/6-15/24-1641572
3/18-28/24-1044542
2/5-15/24-1044542
11/2-7/23-1442562
9/18-25/23-1442562
7/7-12/23-2835632
5/8-18/23-2337603
3/13-22/23-2735623
1/9-20/23-2934633
11/15-22/22-3432662
9/7-14/22-3034642
7/5-12/22-2834624
5/9-19/22-2635613
3/14-24/22-2536613
1/10-21/22-3532671
11/1-10/21-3332653
Marquette Law School Poll, national surveys, latest: Jan. 27-Feb. 5, 2025
Question: Do you have a favorable or an unfavorable opinion of the following people or haven’t you heard enough yet to have an opinion?

Vice President JD Vance is seen favorably by 39% and unfavorably by 44%, with 17% saying they haven’t heard enough yet to say. Since being nominated for vice president, Vance has become better known, though, as with all vice presidents, he is less well known than the president. His net favorability has also improved. The trend in Vance’s favorability rating is shown in Table 12.

Table 12: Vance favorability trend

Among adults

Poll datesFavorability
NetFavorableUnfavorableHaven’t heard enough
1/27-2/6/25-5394417
12/2-11/24-12354718
10/1-10/24-15304525
7/24-8/1/24-16274330
Marquette Law School Poll, national surveys, latest: Jan. 27-Feb. 5, 2025
Question: Do you have a favorable or an unfavorable opinion of the following people or haven’t you heard enough yet to have an opinion?

Direction of the country

Opinion about the direction of the country remains negative, with 62% saying the country is off on the wrong track and 38% saying it is headed in the right direction. However, the percentage saying right direction has nearly doubled from October 2024, when 20% said the country was headed in the right direction and 80% said it was on the wrong track.

Table 13: Direction of the country

Among adults

Poll datesDirection of country
Right directionWrong track
1/27-2/6/253862
12/2-11/242575
10/1-10/242080
Marquette Law School Poll, national surveys, latest: Jan. 27-Feb. 5, 2025
Question: Do you feel things in this country are generally going in the right direction, or do you feel things have gotten off on the wrong track?

The changing views of the direction of the country are closely tied to partisanship and the change of administration. In the current poll, 76% of Republicans say the country is headed in the right direction, while 7% said the same in October. Among Democrats, views moved in the opposite direction, with 7% currently saying the country is heading in the right direction, compared to 33% in October. Independents have changed their views less, with 20% saying right direction now, compared to 14% in October.

Table 14: Direction of the country, by party identification

Among adults

Poll datesDirection of country
Right directionWrong track
Republican
1/27-2/6/257624
12/2-11/242278
10/1-10/24793
Independent
1/27-2/6/252080
12/2-11/242773
10/1-10/241486
Democrat
1/27-2/6/25793
12/2-11/242971
10/1-10/243367
Marquette Law School Poll, national surveys, latest: Jan. 27-Feb. 5, 2025
Question: Do you feel things in this country are generally going in the right direction, or do you feel things have gotten off on the wrong track?

Economic conditions

There has been a substantial decline since July in the percentage of the public who say the economy is poor, but little change in the percentage saying it is excellent or good. By contrast, those saying it is not so good have increased. In the current poll, 15% say the economy is poor, a substantial decline from July when 35% said that. Those saying excellent or good make up 27% now, compared to 30% in July. Those saying the economy is not so good rose from 35% in July to 58% in February.

Table 15: Views of the national economy

Among adults

Poll datesNational economy
ExcellentGoodNot so goodPoor
1/27-2/6/251265815
12/2-11/244255021
10/1-10/243214531
7/24-8/1/243273535
5/6-15/243264031
3/18-28/244273930
2/5-15/245274126
11/2-7/232224233
9/18-25/233184732
Marquette Law School Poll, national surveys, latest: Jan. 27-Feb. 5, 2025
Question: How would you describe the state of the nation’s economy these days?

Economic conditions by party identification

Each partisan group is less negative about the economy now than in July, with the largest change coming among Republicans who have shifted from 49% seeing a poor economy in July to 10% now. Among independents, 48% said the economy was poor in July and 24% said it was poor in February. Democrats’ views have barely changed from 18% saying poor in July to 16% in February.

Table 16: Views of the national economy, by party identification

Among adults

Poll datesNational economy
Excellent/GoodNot so goodPoor
Republican
1/27-2/6/25276310
12/2-11/24115732
10/1-10/2484744
7/24-8/1/24123849
5/6-15/24104049
3/18-28/24144541
2/5-15/24154639
11/2-7/2394052
9/18-25/2364351
Independent
1/27-2/6/25166024
12/2-11/24205525
10/1-10/24183844
7/24-8/1/24232948
5/6-15/24195130
3/18-28/24184537
2/5-15/24184537
11/2-7/23115138
9/18-25/2385735
Democrat
1/27-2/6/25335116
12/2-11/2451418
10/1-10/24414415
7/24-8/1/24493218
5/6-15/24493714
3/18-28/24533215
2/5-15/2455359
11/2-7/23444214
9/18-25/23384814
Marquette Law School Poll, national surveys, latest: Jan. 27-Feb. 5, 2025
Question: How would you describe the state of the nation’s economy these days?

About the Marquette Law School Poll

The survey was conducted Jan. 27-Feb. 5, 2025, interviewing 1,018 adults nationwide, with a margin of error of +/-3.5 percentage points.

Interviews were conducted using the SSRS Opinion Panel, a national probability sample with interviews conducted online. Certain other data from this survey (focusing on public opinion concerning the Supreme Court) are held for release on Feb. 13. The detailed methodology statement, survey instrument, topline results, and crosstabs for this release are available on the Marquette Law Poll website.

Question wording on Trump policies and executive orders:

  • Recognize only male and female sexes: “Do you favor or oppose President Trump’s executive order requiring federal agencies to recognize biological sex as male or female only, eliminate references to gender identity in policies, and require federal documents, such as passports, to reflect biological sex, not gender identity?”
  • Deport immigrants in U.S. illegally: “Do you favor or oppose deporting immigrants who are living in the United States illegally back to their home countries?”
  • Expand oil and gas production: “Do you favor or oppose President Trump’s executive orders that aim to expand oil and gas production?”
  • Declare emergency on southern border: “Do you favor or oppose President Trump’s executive order declaring migrant crossings along the U.S.-Mexico border to be a national emergency?”
  • Deport immigrants in U.S. illegally, including without criminal record: “Do you favor or oppose deporting immigrants who are living in the United States illegally back to their home countries even if they have lived here for a number of years, have jobs, and no criminal record?”
  • Take back the Panama Canal: “In his inaugural address, President Trump said the U.S. will take back the Panama Canal from Panama. Do you think the U.S. should take back the Canal, or should Panama continue to control it in accordance with the 1978 Panama Canal Treaties?”
  • Pardon January 6 defendants: “Do you favor or oppose President Trump’s pardon of about 1,500 people convicted in the January 6, 2021 violence at the U.S. Capitol?”
  • Rename Gulf of Mexico: “Do you favor or oppose President Trump’s executive order instructing the Secretary of the Interior to rename the Gulf of Mexico as the Gulf of America?”