
First Quarter 2023 Results and Key Metrics
HIGHLIGHTS
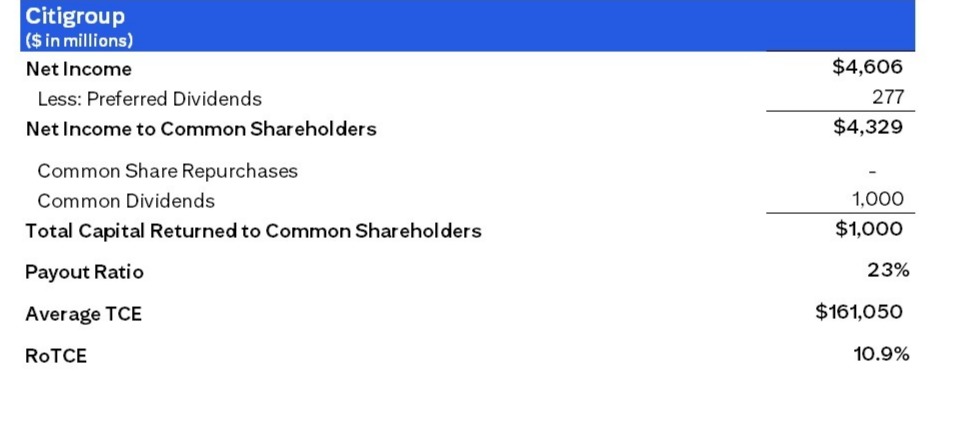
- Returned $1.0 Billion in Dividends to Common Shareholders
- Payout Ratio of 23%3
- Book Value per Share of $96.59
- Tangible Book Value per Share of $84.214
Read the full press release with tables and CEO commentary
View the Financial Supplement (PDF)
View Financial Supplement (Excel)
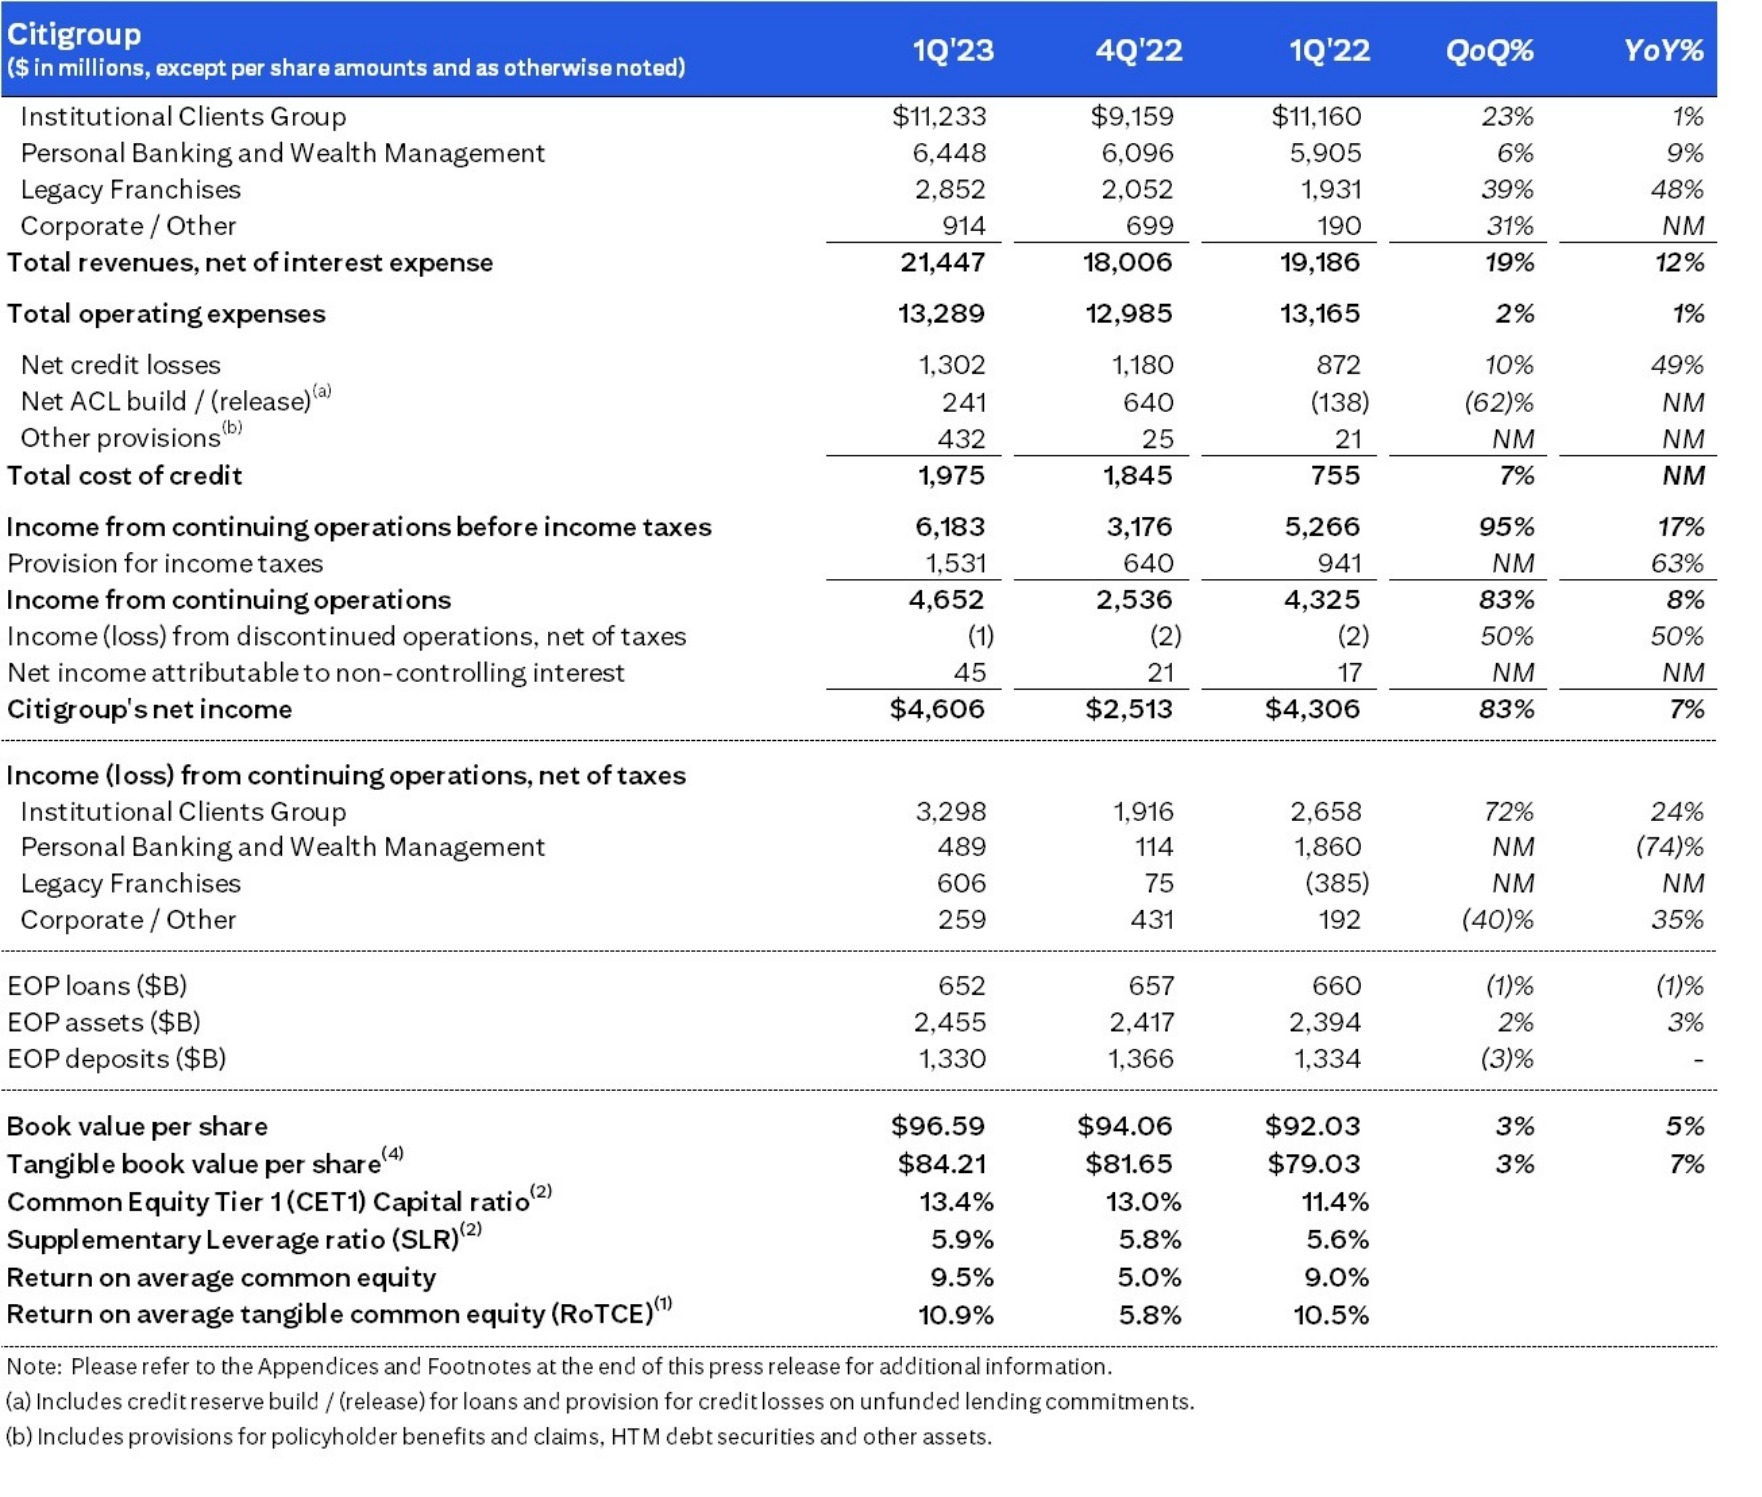
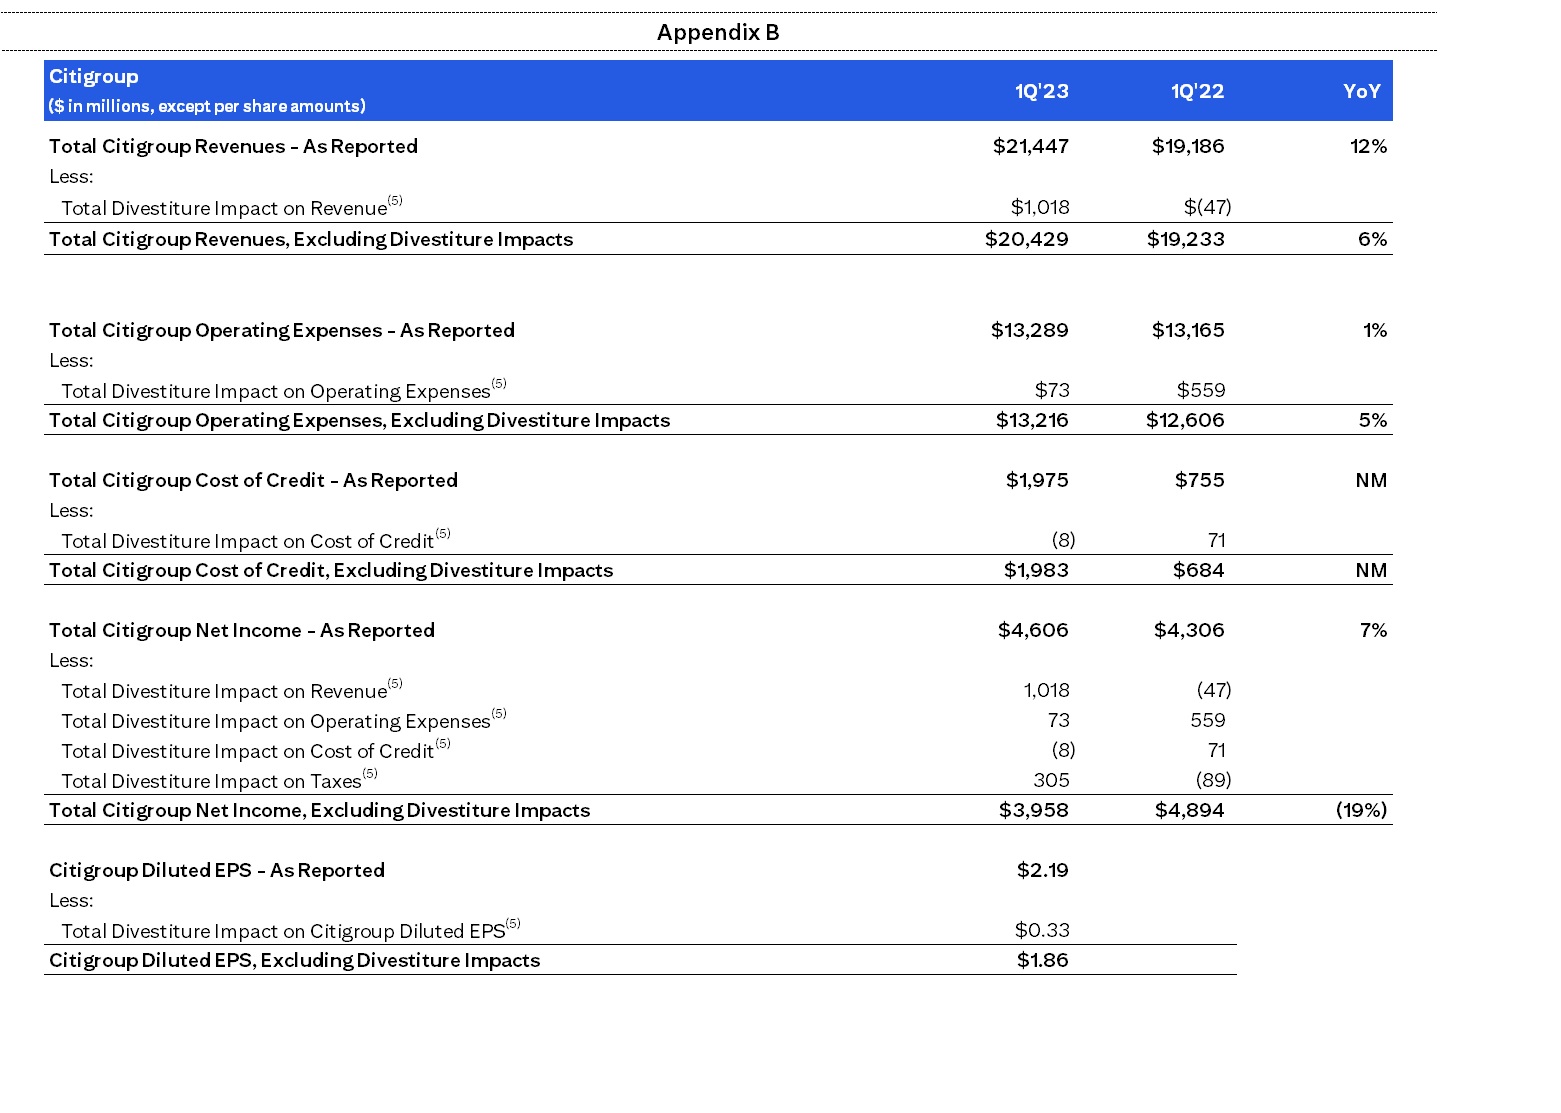
New York, April 14, 2023 – Citigroup Inc. today reported net income for the first quarter 2023 of $4.6 billion, or $2.19 per diluted share, on revenues of $21.4 billion. This compares to net income of $4.3 billion, or $2.02 per diluted share, on revenues of $19.2 billion for the first quarter 2022.
First quarter results included divestiture-related impacts of $953 million5 in earnings before taxes ($648 million after-tax), primarily driven by a gain on the sale of the India consumer business, recorded in Legacy Franchises. Excluding these divestiture-related impacts, earnings per share was $1.865. This compares to divestiture-related impacts in the first quarter 2022 of $(677) million5 in earnings before taxes ($(588) million after-tax), primarily driven by a goodwill impairment related to Asia Consumer Banking, also recorded in Legacy Franchises.
Revenues increased 12% from the prior-year period and 6% excluding the divestiture-related impacts5, as growth in net interest income was partially offset by lower non-interest revenues. The higher net interest income was driven by the impact of higher interest rates across businesses, including Services and Markets in Institutional Clients Group (ICG), as well as strong growth in average loans in US Personal Banking within Personal Banking and Wealth Management (PBWM). The lower non-interest revenues reflected declines in Investment Banking and Markets in ICG and lower investment product revenues in Global Wealth Management in PBWM.
Net income of $4.6 billion increased 7% from the prior-year period, and decreased 19% excluding the divestiture-related impacts5. The increase in net income was primarily driven by the higher revenue, partially offset by higher expenses and higher cost of credit.
Earnings per share of $2.19 increased 8% from the prior-year period, reflecting the higher net income and an approximate 1% decline in average diluted shares outstanding.
Citi CEO Jane Fraser said, “Citi delivered strong operating performance, showing good revenue growth and expense discipline despite the tumultuous environment for banks. Our robust and well-managed balance sheet was a source of strength for our clients and we continue making progress in executing our strategy focused on our five core interconnected businesses while simplifying and transforming the firm.
“TTS continued to perform extremely well, growing non-interest revenue on new mandates and strong cross-border activity. Markets saw the third best quarter in the last decade in Fixed Income. Banking activity picked up from the end of 2022. Our two cards businesses are showing momentum. While it is not an ideal environment for wealth management, the drivers of this business continue to be very positive, and we announced that Andy Sieg will be joining us as its CEO later this year.
“We closed the sale of two consumer franchises, which contributed to our healthy pace of capital generation. We ended the quarter with a CET1 ratio of 13.4%. We are committed to increasing the amount of excess capital we return over time as well as delivering with excellence for our clients and shareholders,” Ms. Fraser concluded.
Percentage comparisons throughout this press release are calculated for the first quarter 2023 versus the first quarter 2022, unless otherwise specified.
First Quarter Financial Results
Citigroup
Citigroup revenues of $21.4 billion in the first quarter 2023 increased 12%. Excluding the divestiture-related impacts, primarily driven by the gain on the sale of the India consumer business in the current quarter, revenues were up 6%. The higher revenues reflected strength across Services and Fixed Income Markets, as well as strong average loan growth in US Personal Banking. The higher revenues were partially offset by a decline in Investment Banking and Equity Markets and lower investment product revenues in Global Wealth Management, as well as impacts from the closed exit markets and wind-downs.
Citigroup operating expenses of $13.3 billion in the first quarter 2023 increased 1%. Operating expenses included approximately $73 million of divestiture-related costs in the current quarter, compared to approximately $559 million in the prior-year period. Excluding these costs in both periods, expenses increased 5%, largely driven by transformation investments and other risk and control investments, resulting in an increase in direct staff, driving higher compensation and benefits. This increase in expenses was also driven by the impact of inflation and severance costs. The increase in expenses was partially offset by the benefit of productivity savings and foreign exchange translation as well as expense reduction from the closed exit markets and wind-downs.
Citigroup cost of credit was approximately $2.0 billion in the first quarter 2023, compared to $0.8 billion in the prior-year period, reflecting a net build in the allowance for credit losses (ACL) for loans and unfunded commitments of $241 million and other provisions of $432 million, primarily driven by macroeconomic deterioration and growth in card revolving balances in PBWM. This compared to a net ACL release for loans and unfunded commitments of $(138) million in the prior-year period. The higher cost of credit also reflected higher net credit losses, primarily driven by ongoing normalization in Branded Cards and Retail Services.
Citigroup net income of $4.6 billion in the first quarter 2023 increased 7% from the prior-year period, primarily driven by the higher revenue, partially offset by the higher expenses and the higher cost of credit. Citigroup’s effective tax rate was approximately 25% in the current quarter, including the impact of divestitures, versus 18% in the first quarter 2022, which had higher discrete tax benefits.
Citigroup’s total allowance for credit losses on loans was approximately $17.2 billion at quarter end, with a reserve-to-funded loans ratio of 2.65%, compared to $15.4 billion, or 2.35% of funded loans, at the end of the prior-year period. Total non-accrual loans decreased 23% from the prior-year period to $2.6 billion. Consumer non-accrual loans decreased 8% to $1.4 billion and corporate non-accrual loans decreased 35% to $1.2 billion.
Citigroup’s end-of-period loans were $652 billion at quarter end, down 1% versus the prior-year period, as growth in PBWM was more than offset by a decline in ICG and Legacy Franchises.
Citigroup’s end-of-period deposits were approximately $1.3 trillion at quarter end, largely unchanged versus the prior-year period, as a decrease in PBWM, largely reflecting Wealth clients putting cash to work in fixed income investments on the businesses’ platform, was offset by an increase in institutional certificates of deposit in Corporate / Other.
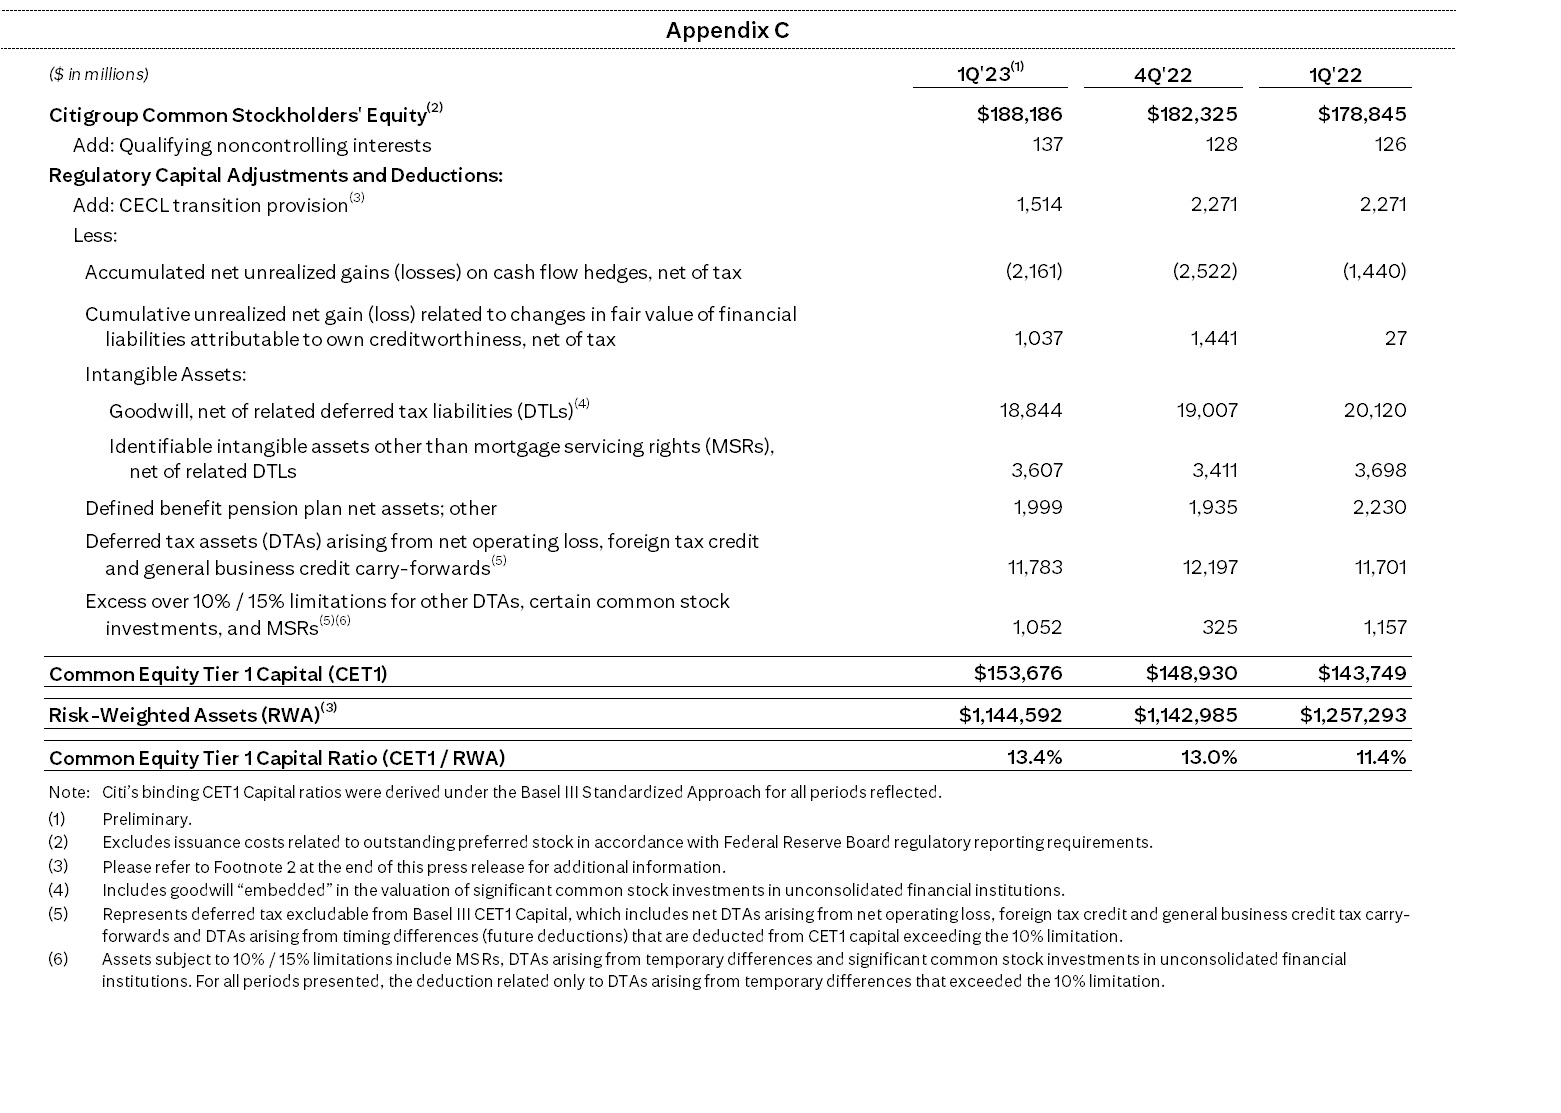
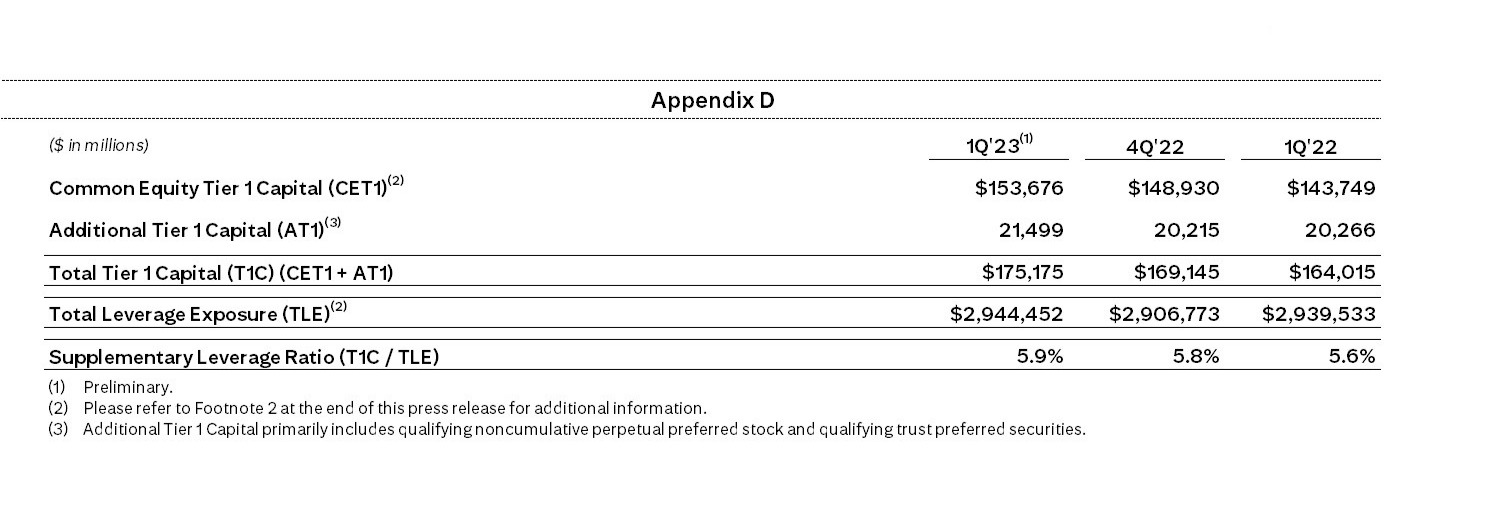
Citigroup’s book value per share of $96.59 and tangible book value per share of $84.21 at quarter end increased 5% and 7%, respectively, versus the prior-year period, largely driven by net income, partially offset by adverse movements in the accumulated other comprehensive income (AOCI) component of equity and the payment of common dividends. At quarter end, Citigroup’s CET1 capital ratio was 13.4% versus 13.0% in the prior quarter, largely driven by the benefits of net income, closing of exit markets, and positive AOCI impact through Citigroup’s investment portfolio. The increase in the CET1 capital ratio was partially offset by the payment of common dividends. Citigroup’s Supplementary Leverage ratio for the first quarter 2023 was 5.9% versus 5.8% in the prior quarter. During the quarter, Citigroup returned a total of $1 billion to common shareholders in the form of dividends.
Institutional Clients Group
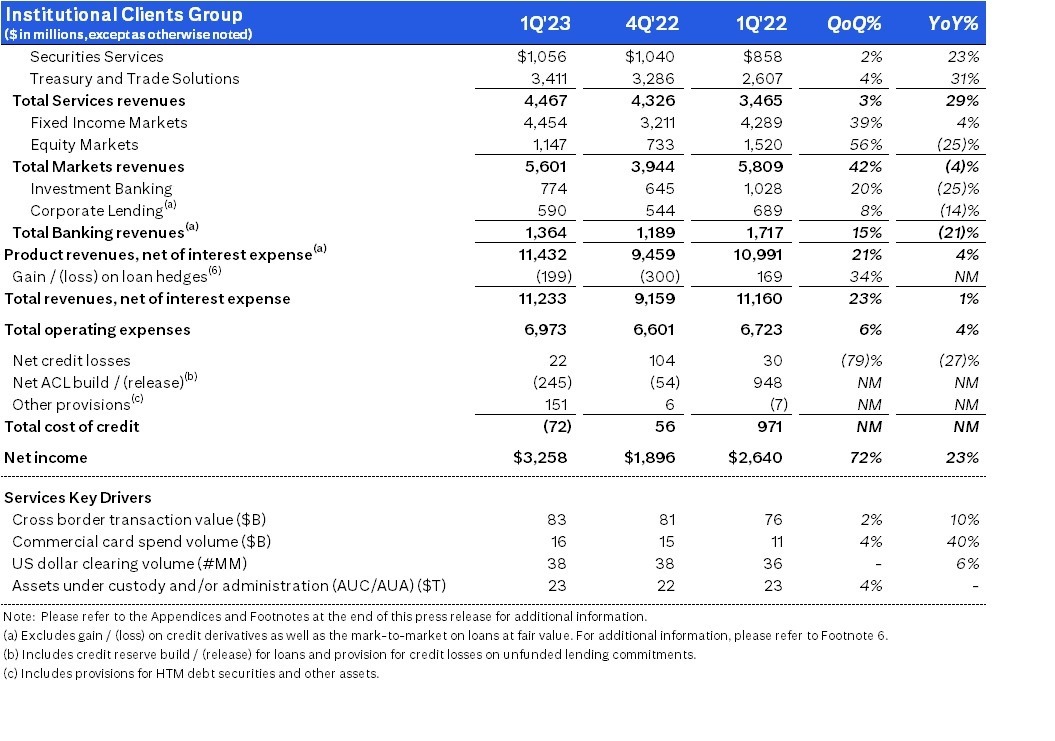
ICG revenues of $11.2 billion were up 1% (including gain/(loss) on loan hedges)6, as strength in Treasury and Trade Solutions (TTS), Securities Services, and Fixed Income Markets was partially offset by declines in Banking and Equity Markets.
Services revenues of $4.5 billion increased 29%. TTS revenues of $3.4 billion increased 31%, driven by 41% growth in net interest income and 13% growth in non-interest revenue. Strong performance in TTS was driven by higher interest rates and business actions, which included growing deposits, managing repricing, and driving fee growth. Securities Services revenues of $1.1 billion increased 23%, as net interest income increased 94%, driven by higher interest rates across currencies, partially offset by a 6% decrease in non-interest revenue due to the impact of lower market valuations on assets under custody and administration.
Markets revenues of $5.6 billion decreased 4%, as growth in Fixed Income Markets was more than offset by a decline in Equity Markets. Fixed Income Markets revenues of $4.5 billion increased 4%, largely driven by strength in rates and currencies, partially offset by lower revenues inspread products / other fixed income. Equity Markets revenues of $1.1 billion were down 25%, primarily reflecting reduced client activity in cash and equity derivatives relative to a very strong quarter last year.
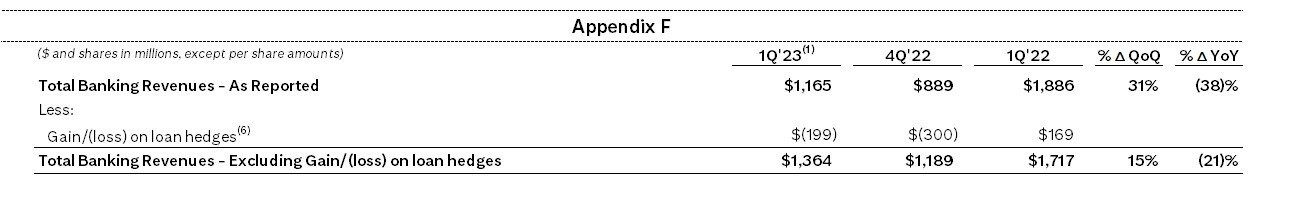
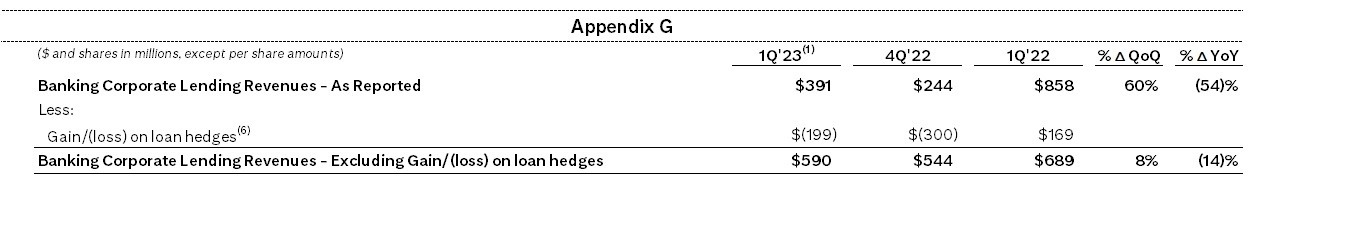
Banking revenues of $1.2 billion decreased 38%, including gain/loss on loan hedges in the current quarter and the prior-year period. Excluding gain/loss on loan hedges6, Banking revenues of $1.4 billion decreased 21%, driven by lower revenues in Investment Banking and Corporate Lending. Investment Banking revenues of $774 million decreased 25%, as continued geopolitical uncertainty, heightened macroeconomic uncertainty and volatility continued to impact client activity. Excluding gain/loss on loan hedges6, Corporate Lending revenues decreased 14% versus the prior-year period, driven by lower volumes and higher credit default swap premiums.
ICG operating expenses of $7.0 billion increased 4%, driven by transformation investments, other risk and control investments, and volume-related expenses, partially offset by the impacts of foreign exchange translation and productivity savings.
ICG cost of credit of $(72) million, compared to $971 million in the prior-year period, included a net ACL release for loans and unfunded commitments of $(245) million, other provisions of $151 million, and net credit losses of $22 million.
ICG net income of $3.3 billion increased 23%, largely driven by the lower cost of credit and the higher revenues, partially offset by the higher expenses.
Personal Banking and Wealth Management
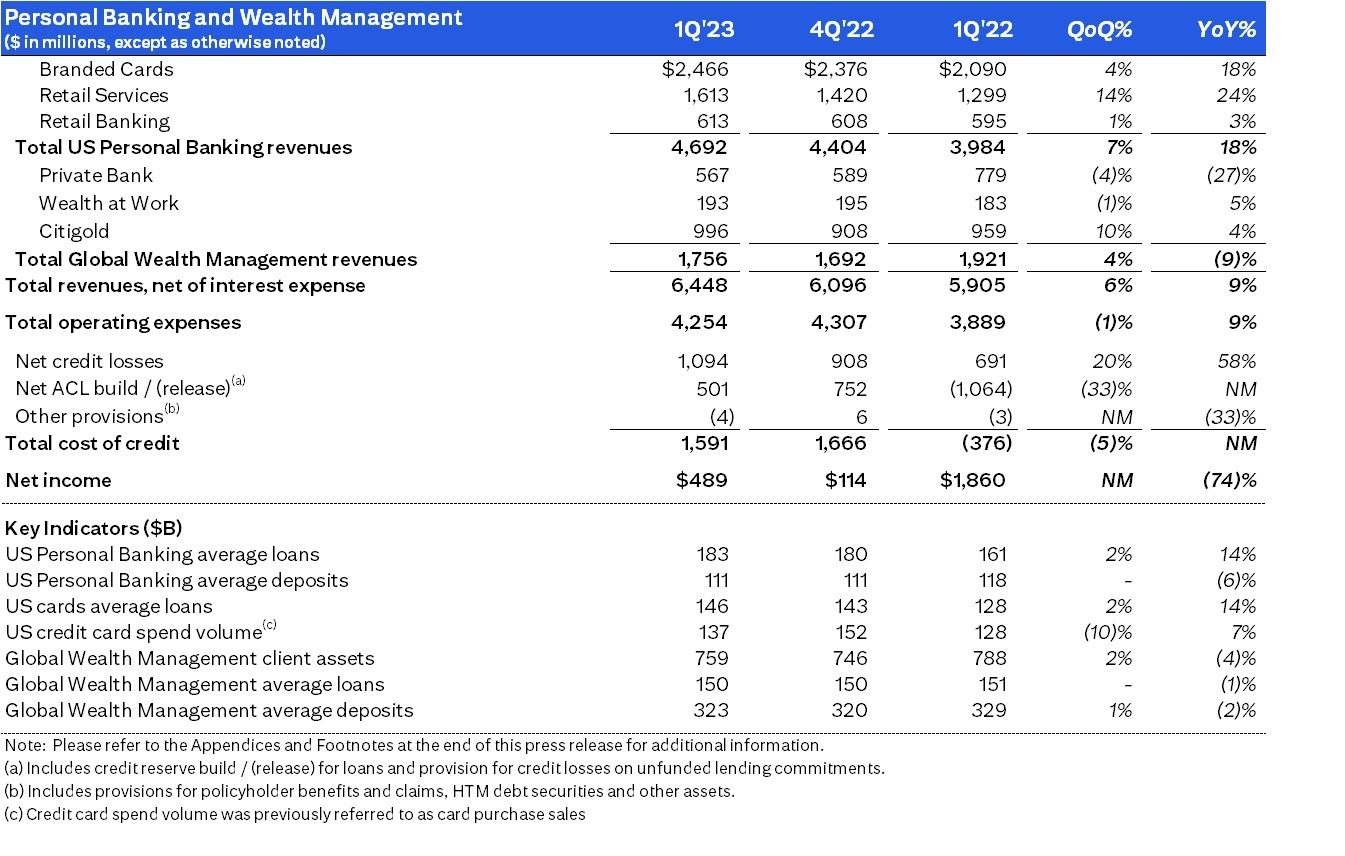
PBWM revenues of $6.4 billion increased 9%, as net interest income growth, driven by strong loan growth across US Personal Banking, was partially offset by a decline in non-interest revenue, driven by the lower investment product revenues in Global Wealth Management.
US Personal Banking revenues of $4.7 billion increased 18%. Branded Cards revenues of $2.5 billion increased 18%, primarily driven by the higher net interest income as card spend volumes increased 9% and average loans increased 15%. Retail Services revenues of $1.6 billion increased 24%, primarily driven by the higher net interest income. Retail Banking revenues of $613 million increased 3%, primarily driven by higher mortgage revenue and strong growth in installment lending, partially offset by the impact of the transfer of relationships and the associated deposit balances to Global Wealth Management.
Global Wealth Management revenues of $1.8 billion decreased 9%, driven by investment product revenue headwinds and higher interest rates paid on deposits, particularly in the Private Bank.
PBWM operating expenses of $4.3 billion increased 9%, primarily driven by investments in transformation and other risk and control investments.
PBWM cost of credit was $1.6 billion, compared to $(376) million in the prior-year period. The increase was largely driven by a net build in the ACL for loans and unfunded commitments of $501 million in the current quarter, primarily driven by a deterioration in macroeconomic assumptions and growth in card revolving balances, compared to a net ACL release of $1.1 billion in the prior-year period. Net credit losses of $1.1 billion increased 58% from near historically low levels, reflecting ongoing normalization in Branded Cards and Retail Services.
PBWM net income of $489 million decreased 74%, driven by the higher cost of credit and the higher expenses, partially offset by the higher revenues.
Legacy Franchises
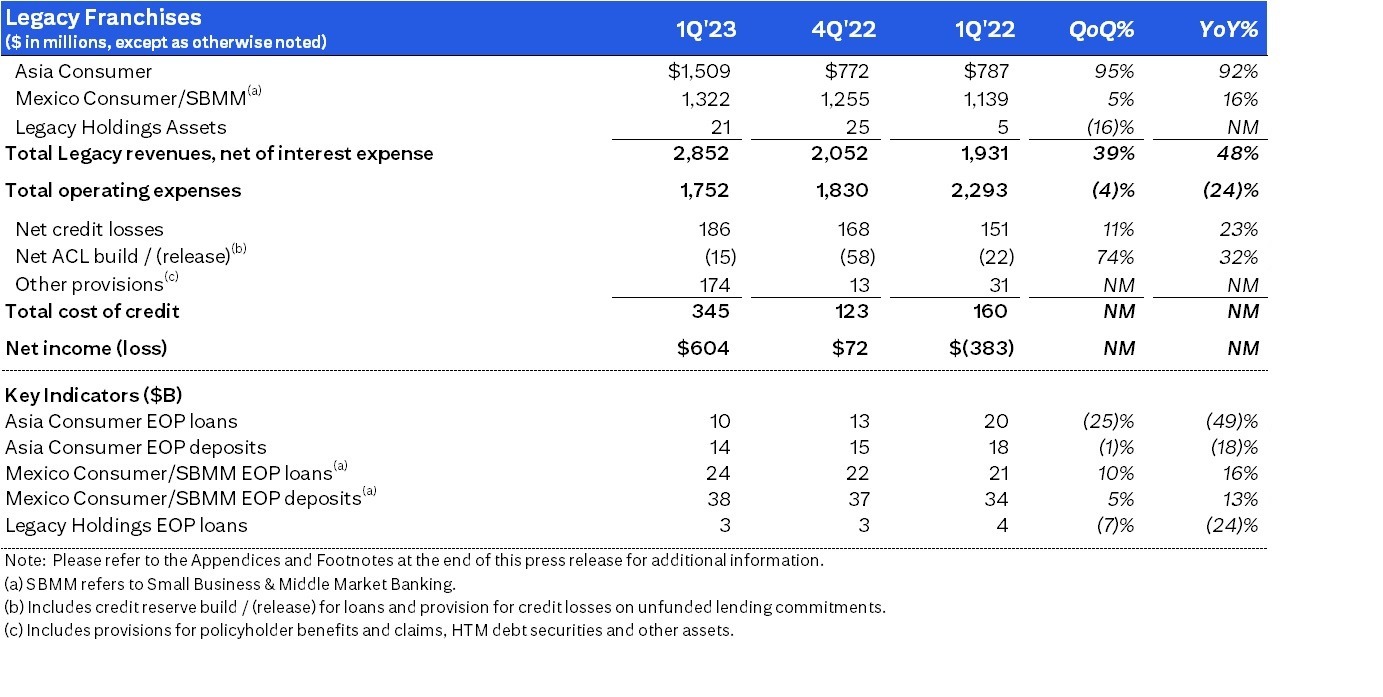
Legacy Franchises revenues of $2.9 billion increased 48%, primarily driven by the gain on the sale of the India consumer business, partially offset by the absence of closed exit markets and wind-downs.
Legacy Franchises expenses of $1.8 billion decreased 24%, largely driven by the absence of the goodwill impairment in Asia recorded in the prior-year period and the benefit of the closed exit markets and wind-downs.
Legacy Franchises cost of credit was $345 million, compared to $160 million in the prior-year period, and included net credit losses of $186 million, other provisions of $174 million driven by macroeconomic deterioration, and a net ACL release of $15 million.
Legacy Franchises net income was $604 million, compared to a net loss of $(383) million in the prior-year period, primarily reflecting the higher revenues and the lower expenses, partially offset by the higher cost of credit.
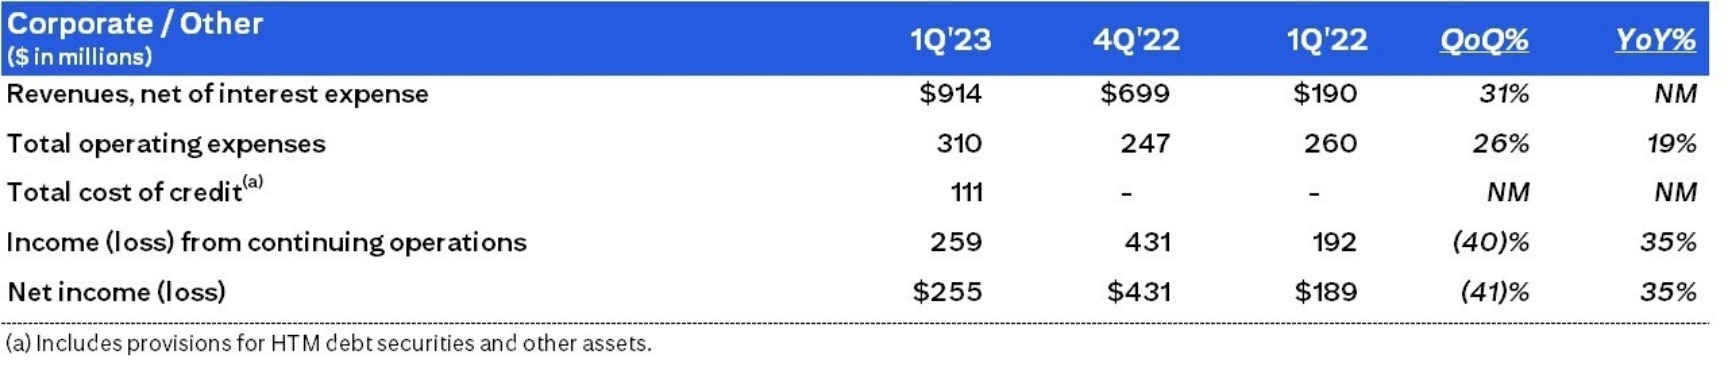
Corporate / Other
Corporate / Other revenues increased to $914 million from $190 million in the prior-year period, largely driven by higher net revenue from the investment portfolio, primarily due to higher interest rates.
Corporate / Other expenses of $310 million increased 19%, driven by increases in transformation and other risk and control investments, partially offset by lower consulting expenses.
Corporate / Other cost of credit of $111 million was driven by a reserve build.
Corporate / Other income from continuing operations was $259 million, compared to $192 million in the prior-year period, largely reflecting the higher net revenue from the investment portfolio.
Citigroup will host a conference call today at 11:00 AM (ET). A live webcast of the presentation, as well as financial results and presentation materials, will be available at www.citigroup.com/citi/investor. Dial-in numbers for the conference call are as follows: (800) 343-1703 (for U.S. and Canada callers) or (785) 424-1226 (for international callers).
Additional financial, statistical and business-related information, as well as business and segment trends, is included in a Quarterly Financial Data Supplement. Both this earnings release and Citigroup’s First Quarter 2023 Quarterly Financial Data Supplement are available on Citigroup’s website at www.citigroup.com.
Citi is a preeminent banking partner for institutions with cross-border needs, a global leader in wealth management and a valued personal bank in its home market of the United States. Citi does business in nearly 160 countries and jurisdictions, providing corporations, governments, investors, institutions and individuals with a broad range of financial products and services.
Additional information may be found at www.citigroup.com | Twitter: @Citi | LinkedIn: www.linkedin.com/company/citi | YouTube: www.youtube.com/citi | Facebook: www.facebook.com/citi
Certain statements in this release are “forward-looking statements” within the meaning of the Private Securities Litigation Reform Act of 1995. These statements are based on management’s current expectations and are subject to uncertainty and changes in circumstances. These statements are not guarantees of future results or occurrences. Actual results and capital and other financial condition may differ materially from those included in these statements due to a variety of factors. These factors include, among others: continued elevated levels of inflation and its impacts; elevated interest rates and the impacts on macroeconomic conditions, customer and client behavior, as well as Citi’s funding costs; potential recessions in the U.S., Europe and other countries; Citi’s ability to execute against its transformation and other strategic initiatives, including consummation of its remaining exits and wind-downs and any loss on sale and temporary capital impacts related to currency translation adjustment (CTA) losses and other impacts; the impacts related to or resulting from recent bank failures and other volatility, including potential increased regulatory requirements and costs and potential impacts to macroeconomic conditions; the impacts related to or resulting from Russia’s war in Ukraine; and the precautionary statements included in this release. These factors also consist of those contained in Citigroup’s filings with the U.S. Securities Exchange and Commission, including without limitation the “Risk Factors” section of Citigroup’s 2022 Form 10-K. Any forward-looking statements made by or on behalf of Citigroup speak only as to the date they are made, and Citi does not undertake to update forward-looking statements to reflect the impact of circumstances or events that arise after the date the forward-looking statements were made.
Contacts:
Investors: Jennifer Landis (212) 559-2718
Press: Danielle Romero-Apsilos (212) 816-2264
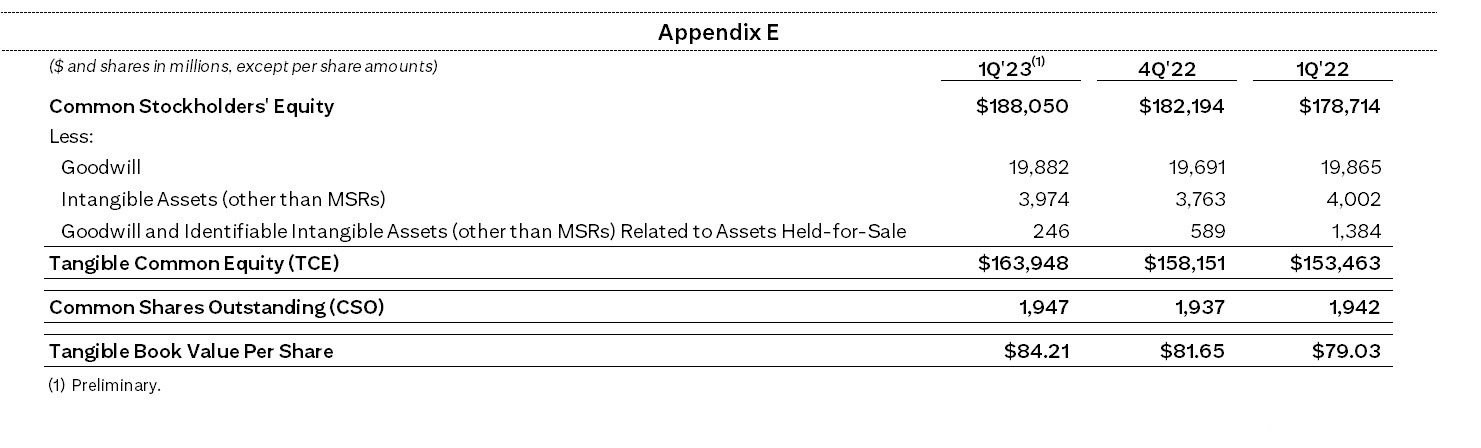
(1) Preliminary. Citigroup’s return on average tangible common equity (RoTCE) is a non-GAAP financial measure. RoTCE represents annualized net income available to common shareholders as a percentage of average tangible common equity (TCE). For the components of the calculation, see Appendix A. See Appendix E for a reconciliation of common equity to tangible common equity.
(2) Ratios as of March 31, 2023 are preliminary. Citigroup’s Common Equity Tier 1 (CET1) Capital ratio and Supplementary Leverage ratio (SLR) reflect certain deferrals based on the modified regulatory capital transition provision related to the Current Expected Credit Losses (CECL) standard. Excluding these deferrals, Citigroup’s CET1 Capital ratio and SLR as of March 31, 2023 would be 13.3% and 5.9%, respectively, on a fully reflected
basis. For additional information, see “Capital Resources—Regulatory Capital Treatment—Modified Transition of the current expected” in Citigroup’s 2022 Annual Report on Form 10-K.
For the composition of Citigroup’s CET1 Capital and ratio, see Appendix C. For the composition of Citigroup’s SLR, see Appendix D.
(3) Citigroup’s payout ratio is the sum of common dividends and common share repurchases divided by net income available to common shareholders. For the components of the calculation, see Appendix A.
(4) Citigroup’s tangible book value per share is a non-GAAP financial measure. See Appendix E for a reconciliation of common equity to tangible common equity and resulting calculation of tangible book value per share.
(5) First quarter 2023 results included divestiture-related impacts of $953 million in earnings before taxes ($648 million after-tax), primarily recorded in Legacy Franchises. This amount included (i) $1 billion primarily related to the gain on sale of the India consumer business, recorded in Other revenue; (ii) $73 million of aggregate divestiture-related costs, recorded in Operating expenses; (iii) an $8 million benefit of divestiture-related credit costs; and (iv) related taxes of $305 million.
First quarter 2022 results included Asia Consumer Banking divestiture-related impacts of $(677) million in earnings before taxes ($(588) million after-tax), recorded in Legacy Franchises, reflecting (i) the revenue impact from a pretax loss due to the sale of the Australia consumer business of $(118) million; this pretax loss included an ACL release of $(104) million and a net revenue impact of $(14) million due to contractual adjustments of the divestiture recorded in Other revenue; (ii) revenues and credit costs also exclude a cost of credit reclass of approximately $71 million, as once a divestiture is classified as held for sale, credit costs, including ACL builds/releases and NCL’s are reclassified to Other Revenue; (iii) the operating expense impact related to a goodwill write-down of approximately $535 million due to the re-segmentation and sequencing of divestitures, as well as costs related to the Korea Voluntary Early Retirement Program (VERP) of $24 million; and (iv) related taxes of $(89) million.
Results of operations excluding these divestiture-related impacts are non-GAAP financial measures. For a reconciliation to reported results, please refer to Appendix B.
(6) Credit derivatives are used to economically hedge a portion of the Corporate Lending portfolio that includes both accrual loans and loans at fair value. Gain / (loss) on loan hedges includes the mark-to-market on the credit derivatives and the mark-to-market on the loans in the portfolio that are at fair value. In the first quarter 2023, gain / (loss) on loan hedges included $(199) million related to Corporate Lending, compared to $169 million in the prior-year period. The fixed premium costs of these hedges are netted against the Corporate Lending revenues to reflect the cost of credit protection. Citigroup’s results of operations excluding the impact of gain / (loss) on loan hedges are non-GAAP financial measures. For a reconciliation to reported results, please refer to Appendix F and G.
Sign up to receive the latest news from Citi.


