In the 22 midterm elections from 1934 -2018, the President's party has averaged a loss of 28 House seats and four Senate seats. The president’s party gained seats in the House only three times, but gained seats in the Senate on six occasions. The president’s party has gained seats in both houses only twice.
The incumbent president’s ability to launch new major policy initiatives would be greatly weakened under divided government. If the Democrats lose control of either House, the Administration can expect to be the target of numerous disruptive congressional inquiries.
Using the data we discuss below (and provide here) we would expect Democratic seat losses of around 30 in the House and 3 in the Senate. There are large error bounds around these estimates. The prediction range includes the possibility of a narrow Democratic gain in the Senate, but loss of the majority in the House seems likely. Graphs below show the two-variable relationships.
Democrats have a 9 seat margin currently in the House (with four seats vacant) and the parties are tied in the Senate. A Democratic loss in the House of fewer than 12 seats would be very unexpected.
Like many midterm projections, these estimates are based on aggregated data. There is no measure of current national controversies (for example, abortion or Trump-related litigation controversies). Both will affect turnout. Nor do we have any explicit measure of conditions and candidates in specific elections. Turnout is likely to be larger than normal, and usually that would be expected to favor the Democrats.
Partisan seat swings in midterm elections are consistently correlated with two factors:
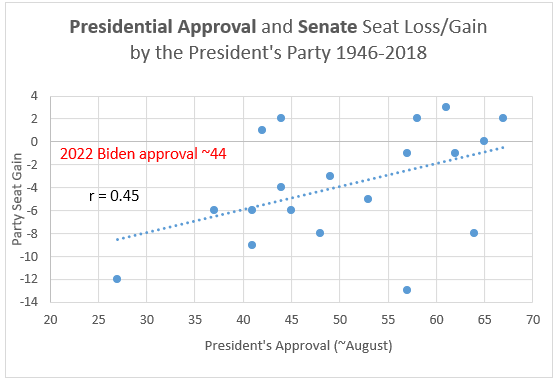
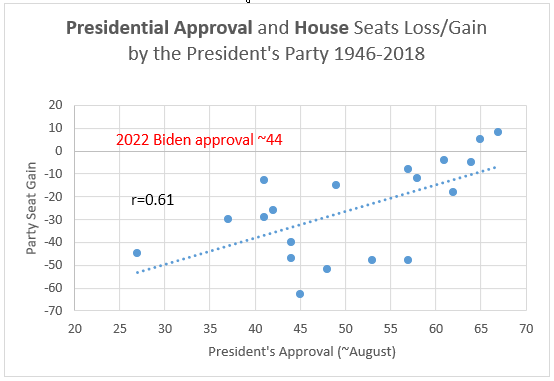
- The level of public approval of the incumbent President. As approval falls the greater the number of seats lost by the President’s party. In this sense the midterm is taken as a referendum on the incumbent president.
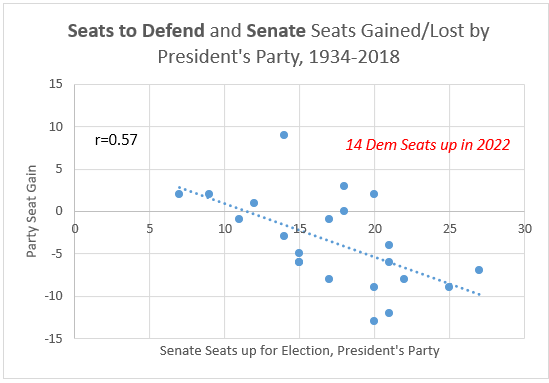
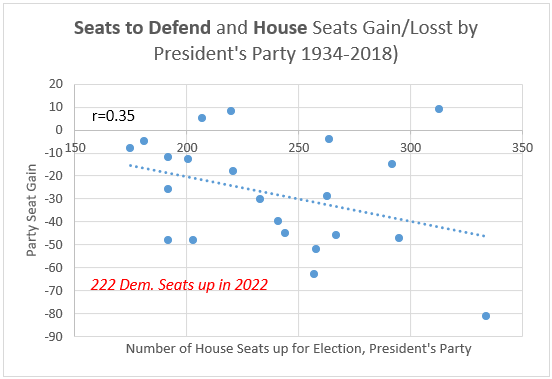
- The number of seats each house of Congress up for election controlled by the President's party. As the number of seats to defend increases, the greater the number of seats lost.
Approval: President Biden’s approval ratings have been in the low 40% range for most of 2022. The most recent data (as of this writing) show an approval rate of 44%. In our graphs, one can see the typical positive association between approval and seat loss/gain in both the House and Senate. In both instances the correlation is moderately strong: r= 0.61 for the House, r = 0.45 for the Senate.
From 1936-2018, near the midterms, six presidents have had approval ratings in the range of 40-45%--like Biden. Those cases involved wide variation in seat loss or gain. The range of outcomes in the Senate was between -9 and +2 seats. The average was a loss of 4. In the House, presidents with approval between 40-45%, saw their party lose between 63 and 13 seats, with an average loss of 36 seats. There have been no instances of House seat gains for Presidents with approval as low as Biden’s.
Seats to Defend: This year the Democrats defend 222 seats in the House and 14 in the Senate. From 1934-2018, the incumbent party has on average defended 237 seats in the House and 17 in the Senate. Again, our graphs show that the more seats the party defends, the greater the number lost (correlations of r = 0.35 for House and r=0.57 for Senate).
Presidents defending numbers of seats similar to those at stake in 2022 have lost 8 and gained 18 in the House (Eisenhower and G. W. Bush). They have lost 3 and gained 14 in the Senate (Reagan and FDR).
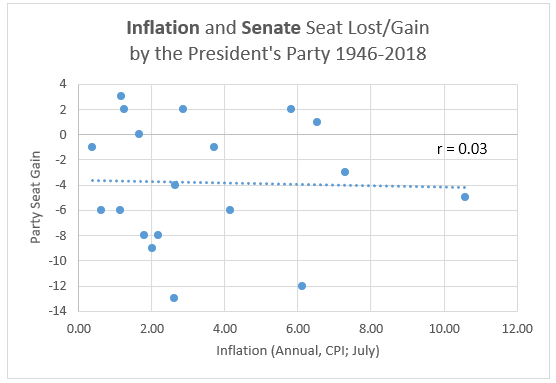
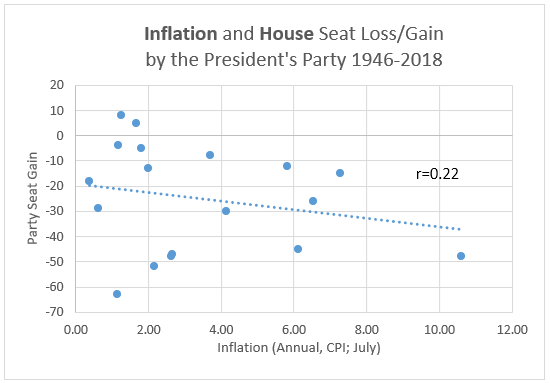
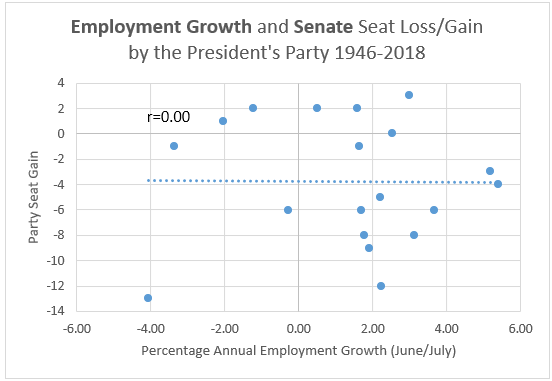
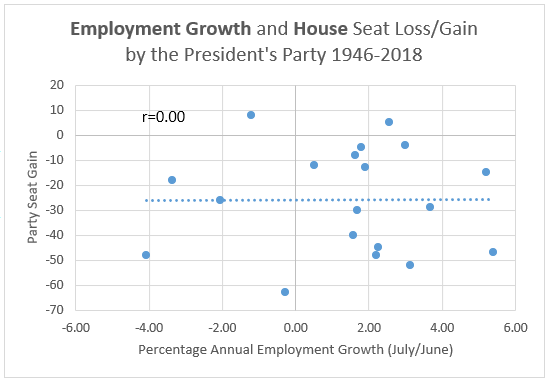
What about the economy, stupid? Some observers expect a negative effect for Biden from recent inflation, but that may be offset by positive news on jobs. For this analysis, we examined inflation (CPI) and nonfarm jobs growth. Both variables have sometimes seemed important in forecasting presidential elections. Jobs growth figures look quite good for Biden at a year-over-year rate of over 4%. These figures are among the three highest midterm-election-year observations in the period 1946-2018. Inflation is not so great, clocking in recently at 8.4%. That's the second highest reading in a midterm year for the years we examine (exceeded by 1974).
It is perhaps surprising that neither variable is strongly correlated with midterm seat gains or losses. Inflation is weakly negative for House seats, but has a zero correlation for the Senate. Jobs growth or decline has had zero correlation with both the House and Senate seat gains by the President’s party.
Including the economic variables in a regression model results in a slightly better fit in the House model and makes almost no difference for the Senate. The point forecast is basically identical in both models as are the standard errors. The point forecast is for Democrats to have a 29 seat loss in the House, and a 3 seat loss in the Senate.