Highlights:
- The average car loses 31.0% of its value after 3 years, but yellow cars only lose 24.0%, while gold cars lose 34.4% of their value
- Yellow, orange, and green cars lose between $9,951 and $13,667 in value after 3 years
- Gold, white, and black cars drop the most in value, losing over $15,000 after 3 years
- Used car depreciation is much higher compared to a few years ago, with a much narrower range of depreciation between colors
A vehicle’s color can impact its used value by more than $5,000 after just 3 years, according to new research by iSeeCars.com. This year’s study compared pricing data for over 1.2 million 3-year-old used cars to determine the impact of color on resale value. It’s worth noting there was a 12.4% point difference in depreciation across colors in June of 2023, but now that range has dropped to 10.4% points this year.
“Yellow and orange have been among the best colors for retained value since iSeeCars began tracking depreciation by color,” said iSeeCars Executive Analyst Karl Brauer. “These are not widely popular colors, but they have more demand than supply, and that translates to higher value on the used market.”
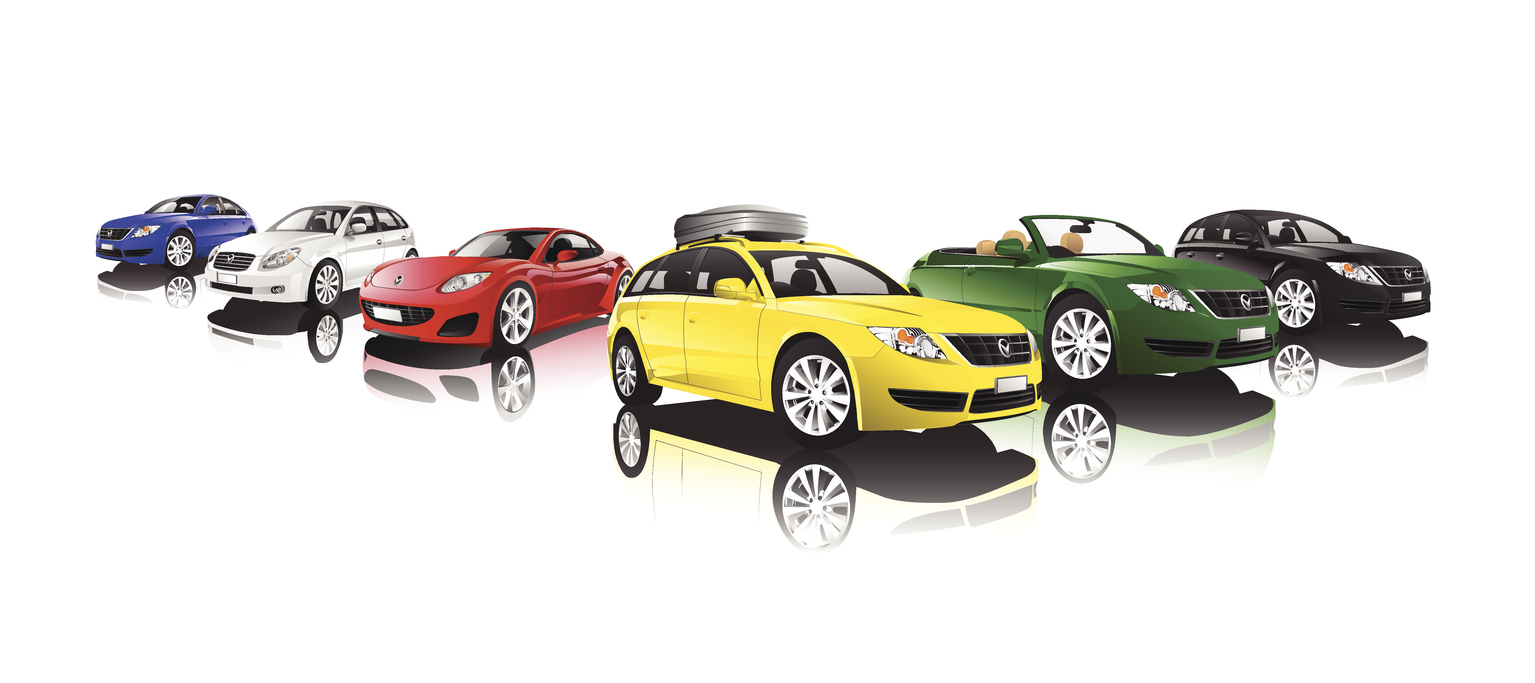
Vehicle Depreciation by Car Color
Yellow cars hold their value best. The study found the average vehicle loses 31% ($14,360) of its value after 3 years. But yellow cars only lose 24.0% ($13,667), followed by orange cars at 24.4% ($9,951), and green cars at 26.3% ($13,152). This means a yellow car can save owners $693 versus the market average, while a gold car costs an owner $2,319. Other above-average colors for value retention include beige, red, silver, brown, gray, and blue
.
“White and black are the two most common car colors, which suggests plenty of people want them,” said Brauer. “But it also means those colors provide zero distinction in the used market, reducing their value and making it easy for buyers to shop around for the lowest-priced model in these shades.”
Car Color Depreciation by Vehicle Segment
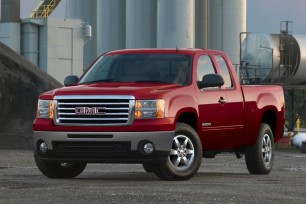
Pickup Trucks: Orange and Green Prove Popular with Truck Buyers
Orange has become almost the default color for high-performance trucks, with both Ford and Toyota offering it on Raptor and TRD Trims. When combined with the small number of trucks produced in this color – only 0.4% – orange ends up as the best color for retained truck value because more people want it compared to the number available in the used market. Green, gray, brown, blue, and silver are also better-than-average for retained value, while black, white, beige, and red are worse than average.
“Orange isn’t a color with widespread appeal, but because multiple brands use it to represent high-performance models, including the Ford F-150 Raptor and Toyota Tacoma TRD Pro, it’s gained favor with truck buyers,” said Brauer.
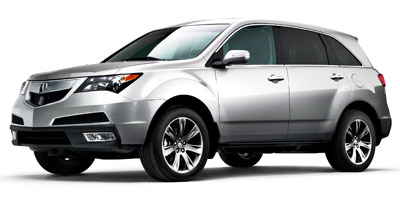
SUVs: The Most Popular Segment Values Unpopular Colors
SUVs now dominate the U.S. car market, but the most valuable colors for used SUVs are rare ones like orange, green, and yellow. More common colors, including black and white, have nearly 50% of the segment’s share, but are the least valuable in the used SUV market. These colors lose more than $17,000 on average after 3 years.
“While orange and yellow may be a bit much for many SUV buyers, the second-best color for value retention, green, is pretty tame by comparison,” said Brauer. “Green might be an excellent option for SUV shoppers looking to retain value.”
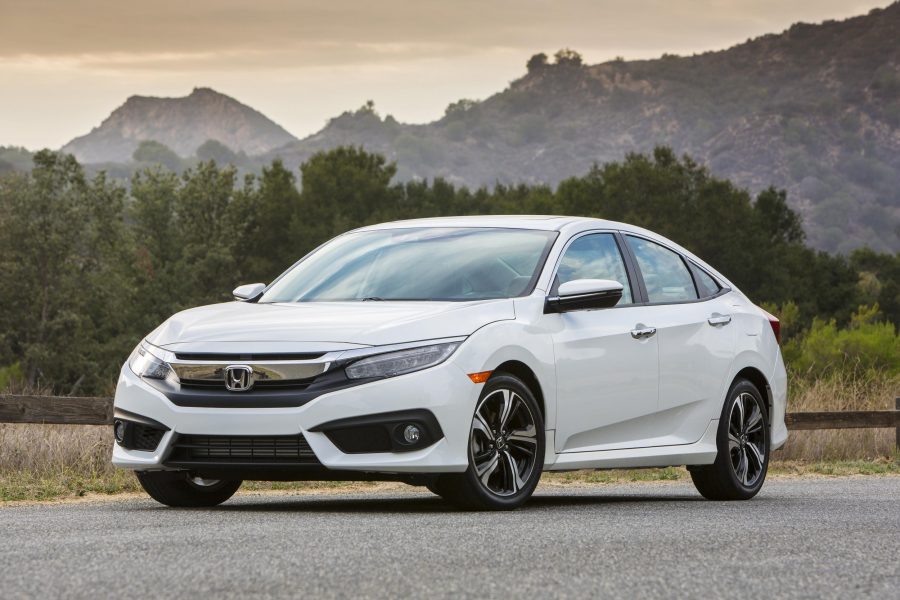
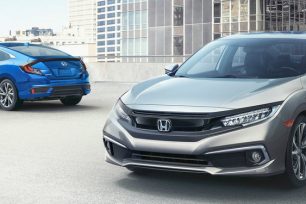
Sedans: Green Doesn’t Mean “Green” for Sedans
The color rankings for sedans follow the overall market pretty closely, with orange, yellow, and beige doing well, while gold, white, and black rank poorly. But green stands out as the second-worst color for sedan value retention, while it’s the third best color across the entire market.
“Apparently used sedan buyers don’t appreciate a green vehicle,” said Brauer. “New car buyers should keep this in mind when ordering their next sedan.”
Minivans: Kids and Crazy Colors Don’t Mix
Minivan buyers clearly reject the overall market’s take on bright colors. The top-ranked shades, green, brown, silver, red, and blue, are all relatively mild, while colors like yellow and orange aren’t even available.
“It’s not too surprising to see parents rejecting bright colors for family transportation,” said Brauer. “They probably have enough vibrant shades in their lives.”
Coupes: Let the Good Time Glow
By nature, coupes are a less practical and more personal form of transportation. Buyers in this segment like expressing themselves through brighter colors, and the used car market rewards coupes in colors like yellow and orange with higher value.
“Performance versions of the Camaro, Corvette, Mustang, and 911 are often ordered in bright colors to reflect their special status, and this makes them more valuable on the used market,” said Brauer.
Convertibles: Brighter Hues Mean Higher Prices
The convertible segment rewards bright colors more than any other vehicle type while simultaneously punishing common colors like silver, black, and white. If you’re looking to buy a drop top and retain value, go flashy or go home in your grayscale color choice.
“If you’re driving a convertible, you’ve already chosen a higher-visibility vehicle type,” said Brauer. “Go ahead and get a brightly colored model, put the top down, and revel in your ‘center-of-attention’ status.”
Keep in mind that a higher retained value doesn’t necessarily mean these colors are the most sought after by used car buyers, but it suggests they are the colors with the biggest discrepancy between low supply and high demand.
Car Color Depreciation in Top 50 Metro Areas
Across the nation’s top 50 metro areas by population, the color with the lowest depreciation is uniformly yellow, matching national trends, while the color with the highest depreciation varies between being white in most places and black in seven metro areas.
Methodology
iSeeCars.com analyzed over 1.2 million model year 2022 used cars from August 2024 through May 2025. The MSRP of each car was adjusted for inflation to 2025 dollars and then compared to the car’s list price. The data were then aggregated by car color and body style.
About iSeeCars.com
iSeeCars.com is a data-driven car search and research company that helps shoppers find the best car deals by providing key insights and valuable resources, including the iSeeCars VIN Check report and Best Cars Rankings. iSeeCars has saved users over $440 million so far by applying big data analytics powered by over 25 billion (and growing) data points and using proprietary algorithms to objectively analyze, score and rank millions of new cars and used cars.