BTC.D: is the last push coming? Or altseasson starting?BTC.D is showing weakness — and if you’re like me, waiting for the altseason to cash in your profits, the market is once again testing your patience.
Historically, the final phase of an altseason can last up to a month and often delivers 50%+ of the entire bull market gains. 🚀
This is not an event
Key data points
Previous close
58.57
Open
58.57
Day's range
58.34 — 58.66
About Market Cap BTC Dominance, %
Coin
On crypto market, a coin dominance is a ratio of its market cap to cumulative market cap of cryptocurrencies. It's a great way to see how big a coin is relative to the whole crypto market — the value of everything is in comparison. It's calculated by dividing a coin market cap by the overall market cap of the top 125 coins and then multiplying it by 100. The result of these calculations and how it changes over time you can see on the dominance chart — calculated for you by TradingView.
No news here
Looks like there's nothing to report right now

$BTC.D Head and Shoulders Topple to 42%If I were a betting man, this is what the future holds for ₿itcoin Dominance.
A head and shoulders pattern could very well be the eventual topple for CRYPTOCAP:BTC.D as we see it make it's way down to 42% which follows previous cycle's trend.
the RSI shows room for correction back up for one mo

Bullish Now, Bitcoin & The Altcoins · 2025 Bull Market ContinuesThe altcoins market cannot be bearish at the same time that Bitcoin Dominance (BTC.D) is bearish. When Bitcoin Dominance is bearish the altcoins market is bullish. When the altcoins market is bullish Bitcoin is already growing or set to grow.
Here we have the daily chart for Bitcoin Dominance. Here

Bitcoin Dominance Continues To Drop (Bullish Crypto)While Bitcoin Dominance (BTC.D) continues to drop, the altcoins continue to consolidate, to recover. Not all of them are up and to be honest, most of them are down, and this is good news.
Even after all this time and all we've seen and waited, still, there are many opportunities available; meaning,

Bitcoin Dominance at Channel Resistance –Will Altcoins Take Off?BTC Dominance has been moving inside a clear descending channel, and right now, price is testing the upper boundary (channel resistance).
Here’s what the price action is telling us:
🔸 If dominance rejects this level and fails to break out, we could see a pullback toward the lower channel, which us


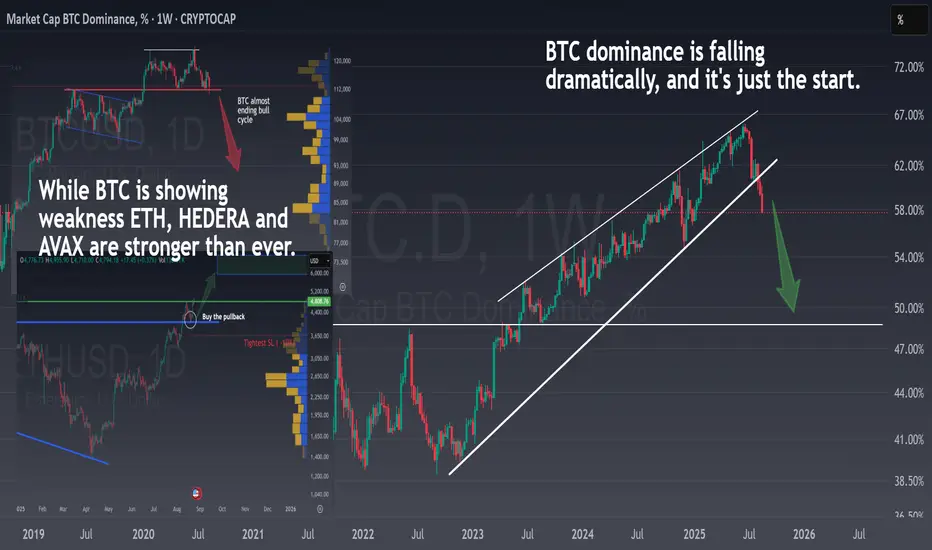
The Bitcoin cycle is over🚨 The Bitcoin cycle is over 🚨
BTC dominance is breaking down fast, right as Bitcoin struggles to hold its key support, meanwhile, altcoins like ETH, HEDERA, and AVAX are smashing through major resistances.
This is classic money rotation: capital is flowing out of BTC and fueling a powerful new al

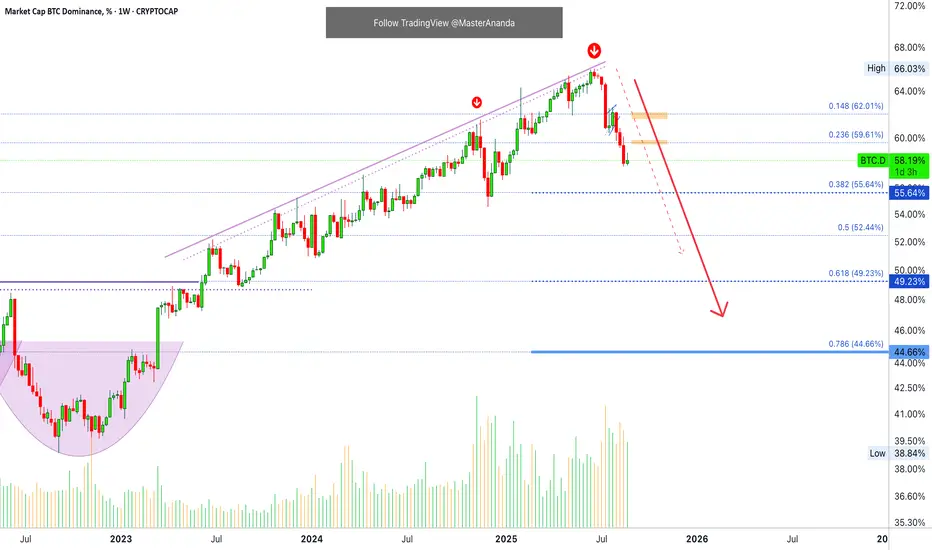
Bitcoin Dominance Continue Dropping, Dec. 2024 Support HoldsThe uptrend ended the 23-June 2025 week. On this date, the index at hand started to decline; Bitcoin Dominance (BTC.D) turned bearish.
Notice how many altcoins bottomed in April, the majority, and yet BTC.D did not peak until June. A delayed effect.
The downtrend is now on and undeniable; the altc
Double Top Inside a Rising Wedge Inside of a Bear FlagTo me, this is super bearish. I see a Double Top (potentially and yet to be confirmed) on the micro time frame. This Double Top is inside of a Bearish Rising Wedge on a larger time frame which is part of a Bear Flag on a macro time frame. Anything could happen, but 3 bearish patterns on the micro an

See all ideas
Summarizing what the indicators are suggesting.
Oscillators
Neutral
SellBuy
Strong sellStrong buy
Strong sellSellNeutralBuyStrong buy
Oscillators
Neutral
SellBuy
Strong sellStrong buy
Strong sellSellNeutralBuyStrong buy
Summary
Neutral
SellBuy
Strong sellStrong buy
Strong sellSellNeutralBuyStrong buy
Summary
Neutral
SellBuy
Strong sellStrong buy
Strong sellSellNeutralBuyStrong buy
Summary
Neutral
SellBuy
Strong sellStrong buy
Strong sellSellNeutralBuyStrong buy
Moving Averages
Neutral
SellBuy
Strong sellStrong buy
Strong sellSellNeutralBuyStrong buy
Moving Averages
Neutral
SellBuy
Strong sellStrong buy
Strong sellSellNeutralBuyStrong buy
Displays a symbol's price movements over previous years to identify recurring trends.