INSIGHTS
Electric Vehicle Outlook 2024
The Electric Vehicle Outlook is our annual long-term publication looking at how electrification, shared mobility, autonomous driving and other factors will impact road transport in the coming decades. The report draws on our team of specialists around the world and looks at scenarios for how these trends will impact the automotive, oil, electricity, infrastructure and battery materials markets, as well as CO2 emissions.

The picture today
EV Sales
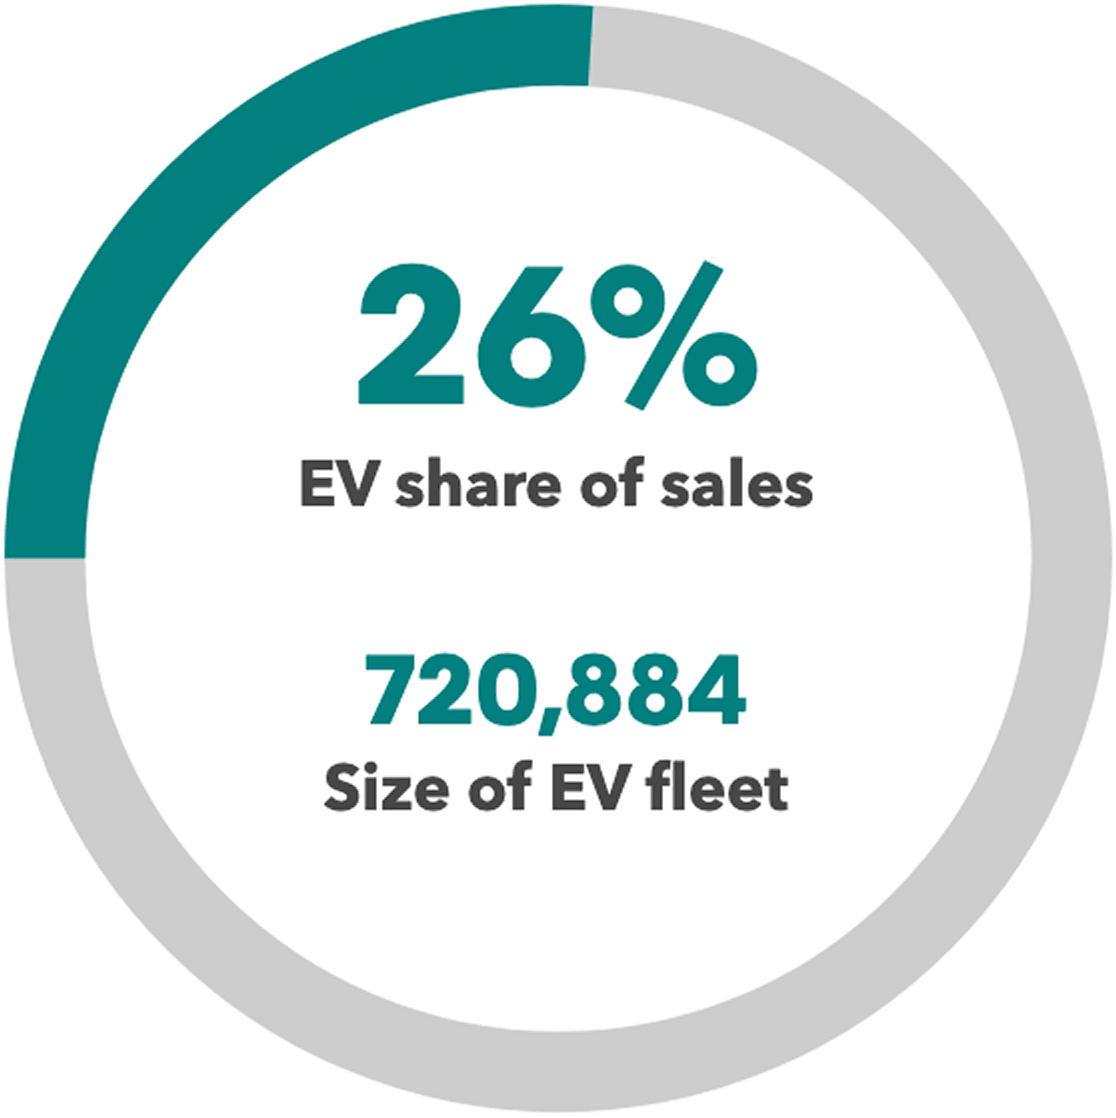
Electric vehicle markets around the world are not all travelling in the same direction or at the same speed in 2024. Sales of EVs continue to rise globally, but some markets are experiencing a significant slowdown and many automakers have pushed back their EV targets. Progress varies by segment, with electric commercial vehicles set for another blistering year and segments like buses and two- and three-wheelers already reaching very high levels of electrification.
Vans and trucks

Buses

Passenger cars

2 and 3 wheelers

Vans and trucks

Buses

Passenger cars

2 and 3 wheelers

Passenger EV sales
China still dominates the global EV market, but sales are rising quickly elsewhere too. Electric vehicles are no longer only a wealthy country phenomenon. Developing economies like Thailand, India, Turkey, Brazil and others are all experiencing record sales as more low-cost electric models are targeted at local buyers.
Global passenger EV sales by market


Global passenger EV sales by drivetrain


Source: BloombergNEF, Marklines, Jato.
Note: Includes highway-capable passenger EVs. Excludes low-speed EVs, e-buses and commercial EVs.
Number of public charging stations
More and more charging points are being built, but each country will have its own optimal mix of home, workplace and public chargers.
Cumulative global public charging connectors


Source: Eco-Movement, BloombergNEF, AFDC, EVCIPA, various public and private sources.
Oil displacement from EVs
EVs of all types are already displacing 1.7 million barrels per day of oil usage, equivalent to about 3% of total road fuel demand.
Oil displacement by vehicle segment
Vans and trucks

Buses

Passenger cars

2 and 3 wheelers

Vans and trucks

Buses

Passenger cars

2 and 3 wheelers

Lithium-ion battery demand
Battery demand is rising quickly. Growth in battery demand for EVs has slowed slightly in the last year, but demand for stationary storage applications is rising faster than ever. Manufacturing of battery cells and the production of key battery components – such as cathodes, anodes, separators and electrolytes – is concentrated in China.
Annual lithium-ion battery demand by application


Reaching net zero by 2050
Reaching 2050 net-zero targets will require swift progress on renewable generation and on adoption of zero-emission vehicles. The report includes a “Net Zero” scenario which investigates what a potential route to carbon neutrality looks like across all segments of road transport by 2050.
This year’s EV Outlook also includes three thematic highlights, each of which explores a different part of the transition in vehicle markets around the world:
THEME
The Return of Plug-In Hybrids
Compound annual growth rate for global passenger vehicle sales from 2019 to 2023, by drivetrain (%)
THEME
China’s Low-Cost Battery Push
Lithium iron phosphate (LFP) battery cell prices ($/kWh)
THEME
EV Driving Distances are Higher Than Expected
Difference in annual battery electric vehicle kilometers traveled compared to internal combustion engine vehicles by market (%)

Source: BloombergNEF, MarkLines, JATO Dynamics, auto associations.

Source: BloombergNEF, ICC Battery. Note: 2023 price from BNEF’s Lithium-ion Battery Price Survey. 2024 price from Jan-Apr from ICC Battery

Source: compiled by BloombergNEF from government agencies, academic institutions and auto associations.
THEME
The Return of Plug-In Hybrids
Compound annual growth rate for global passenger vehicle sales from 2019 to 2023, by drivetrain (%)

Source: BloombergNEF, MarkLines, JATO Dynamics, auto associations.
THEME
China’s Low-Cost Battery Push
Lithium iron phosphate (LFP) battery cell prices ($/kWh)

Source: BloombergNEF, ICC Battery. Note: 2023 price from BNEF’s Lithium-ion Battery Price Survey. 2024 price from Jan-Apr from ICC Battery
THEME
EV Driving Distances are Higher Than Expected
Difference in annual battery electric vehicle kilometers traveled compared to internal combustion engine vehicles by market (%)

Source: compiled by BloombergNEF from government agencies, academic institutions and auto associations.
Key numbers
Number of passenger EVs on the road in 2040 in the Economic Transition Scenario
Gap in the number of electric passenger vehicles on the road between the Economic Transition Scenario and the Net Zero Scenario in 2040
Size of the charging infrastructure market opportunity between today and 2050 in the Economic Transition Scenario
Road transport oil demand peak
Road transport emissions peak
Electricity demand from road transport in 2050 in the Net Zero Scenario
Get the free summary report
Enter your details to download the executive summary and find out more on the implications of EV adoption for energy markets, raw materials, emissions, charging infrastructure and more.
BNEF clients can access the full report, including the breakdown by segment, technology and region, as well as the underlying Excel data and previous editions.