Nominal Wage Tracker
Key numbers on nominal wages
- Actual year-over-year growth for private employees: 3.9%
Year-over-year change in private-sector nominal average hourly earnings, 2007–2025
Nominal Wage Tracker
Year-over-year change in private-sector nominal average hourly earnings, 2007–2025
| date | All nonfarm employees | Production/nonsupervisory workers |
|---|---|---|
| Mar-2007 | 3.4% | 4.1% |
| Apr-2007 | 3.1% | 3.8% |
| May-2007 | 3.5% | 4.1% |
| Jun-2007 | 3.6% | 4.1% |
| Jul-2007 | 3.2% | 4.1% |
| Aug-2007 | 3.3% | 4.0% |
| Sep-2007 | 3.1% | 4.0% |
| Oct-2007 | 3.2% | 3.8% |
| Nov-2007 | 3.1% | 3.8% |
| Dec-2007 | 2.8% | 3.7% |
| Jan-2008 | 2.9% | 3.8% |
| Feb-2008 | 2.9% | 3.7% |
| Mar-2008 | 3.0% | 3.8% |
| Apr-2008 | 2.9% | 3.8% |
| May-2008 | 3.0% | 3.7% |
| Jun-2008 | 2.7% | 3.6% |
| Jul-2008 | 3.2% | 3.7% |
| Aug-2008 | 3.3% | 3.9% |
| Sep-2008 | 3.3% | 3.7% |
| Oct-2008 | 3.3% | 3.8% |
| Nov-2008 | 3.5% | 3.9% |
| Dec-2008 | 3.7% | 4.0% |
| Jan-2009 | 3.6% | 3.7% |
| Feb-2009 | 3.3% | 3.6% |
| Mar-2009 | 3.3% | 3.5% |
| Apr-2009 | 3.4% | 3.3% |
| May-2009 | 3.0% | 3.1% |
| Jun-2009 | 2.9% | 2.9% |
| Jul-2009 | 2.6% | 2.7% |
| Aug-2009 | 2.4% | 2.7% |
| Sep-2009 | 2.5% | 2.7% |
| Oct-2009 | 2.5% | 2.7% |
| Nov-2009 | 2.2% | 2.7% |
| Dec-2009 | 2.0% | 2.4% |
| Jan-2010 | 2.0% | 2.7% |
| Feb-2010 | 2.2% | 2.5% |
| Mar-2010 | 1.9% | 2.3% |
| Apr-2010 | 1.8% | 2.4% |
| May-2010 | 1.8% | 2.6% |
| Jun-2010 | 1.8% | 2.5% |
| Jul-2010 | 1.8% | 2.4% |
| Aug-2010 | 1.8% | 2.4% |
| Sep-2010 | 1.8% | 2.2% |
| Oct-2010 | 1.9% | 2.5% |
| Nov-2010 | 1.8% | 2.2% |
| Dec-2010 | 1.7% | 2.1% |
| Jan-2011 | 2.1% | 2.4% |
| Feb-2011 | 1.8% | 2.1% |
| Mar-2011 | 1.8% | 2.0% |
| Apr-2011 | 1.9% | 2.1% |
| May-2011 | 2.0% | 2.1% |
| Jun-2011 | 2.1% | 2.0% |
| Jul-2011 | 2.3% | 2.3% |
| Aug-2011 | 2.0% | 1.9% |
| Sep-2011 | 1.9% | 2.0% |
| Oct-2011 | 1.9% | 1.8% |
| Nov-2011 | 2.0% | 1.8% |
| Dec-2011 | 2.0% | 1.8% |
| Jan-2012 | 1.7% | 1.3% |
| Feb-2012 | 1.8% | 1.4% |
| Mar-2012 | 2.1% | 1.8% |
| Apr-2012 | 2.1% | 1.6% |
| May-2012 | 1.9% | 1.4% |
| Jun-2012 | 2.0% | 1.5% |
| Jul-2012 | 1.6% | 1.4% |
| Aug-2012 | 1.8% | 1.4% |
| Sep-2012 | 2.0% | 1.5% |
| Oct-2012 | 1.6% | 1.2% |
| Nov-2012 | 1.9% | 1.5% |
| Dec-2012 | 2.2% | 1.7% |
| Jan-2013 | 2.1% | 1.8% |
| Feb-2013 | 2.1% | 2.1% |
| Mar-2013 | 1.9% | 1.9% |
| Apr-2013 | 2.1% | 1.9% |
| May-2013 | 2.1% | 1.8% |
| Jun-2013 | 2.1% | 2.1% |
| Jul-2013 | 2.1% | 2.0% |
| Aug-2013 | 2.3% | 2.2% |
| Sep-2013 | 2.1% | 2.2% |
| Oct-2013 | 2.2% | 2.3% |
| Nov-2013 | 2.2% | 2.3% |
| Dec-2013 | 1.9% | 2.2% |
| Jan-2014 | 2.0% | 2.3% |
| Feb-2014 | 2.4% | 2.6% |
| Mar-2014 | 2.1% | 2.4% |
| Apr-2014 | 2.0% | 2.4% |
| May-2014 | 2.1% | 2.4% |
| Jun-2014 | 2.1% | 2.3% |
| Jul-2014 | 2.1% | 2.3% |
| Aug-2014 | 2.2% | 2.4% |
| Sep-2014 | 2.0% | 2.1% |
| Oct-2014 | 2.0% | 2.2% |
| Nov-2014 | 2.1% | 2.3% |
| Dec-2014 | 1.9% | 1.8% |
| Jan-2015 | 2.1% | 2.0% |
| Feb-2015 | 1.9% | 1.6% |
| Mar-2015 | 2.2% | 2.0% |
| Apr-2015 | 2.3% | 1.9% |
| May-2015 | 2.3% | 2.2% |
| Jun-2015 | 2.1% | 1.9% |
| Jul-2015 | 2.2% | 2.0% |
| Aug-2015 | 2.2% | 2.2% |
| Sep-2015 | 2.3% | 2.1% |
| Oct-2015 | 2.5% | 2.4% |
| Nov-2015 | 2.4% | 2.1% |
| Dec-2015 | 2.5% | 2.5% |
| Jan-2016 | 2.5% | 2.5% |
| Feb-2016 | 2.3% | 2.4% |
| Mar-2016 | 2.4% | 2.3% |
| Apr-2016 | 2.6% | 2.6% |
| May-2016 | 2.4% | 2.3% |
| Jun-2016 | 2.6% | 2.5% |
| Jul-2016 | 2.7% | 2.6% |
| Aug-2016 | 2.5% | 2.3% |
| Sep-2016 | 2.6% | 2.5% |
| Oct-2016 | 2.8% | 2.5% |
| Nov-2016 | 2.6% | 2.4% |
| Dec-2016 | 2.7% | 2.5% |
| Jan-2017 | 2.5% | 2.4% |
| Feb-2017 | 2.7% | 2.4% |
| Mar-2017 | 2.6% | 2.3% |
| Apr-2017 | 2.5% | 2.2% |
| May-2017 | 2.5% | 2.3% |
| Jun-2017 | 2.5% | 2.3% |
| Jul-2017 | 2.6% | 2.3% |
| Aug-2017 | 2.6% | 2.3% |
| Sep-2017 | 2.8% | 2.6% |
| Oct-2017 | 2.3% | 2.2% |
| Nov-2017 | 2.5% | 2.3% |
| Dec-2017 | 2.7% | 2.5% |
| Jan-2018 | 2.8% | 2.5% |
| Feb-2018 | 2.6% | 2.6% |
| Mar-2018 | 2.8% | 2.8% |
| Apr-2018 | 2.8% | 2.8% |
| May-2018 | 2.9% | 2.9% |
| Jun-2018 | 2.9% | 2.9% |
| Jul-2018 | 2.8% | 2.9% |
| Aug-2018 | 3.2% | 3.1% |
| Sep-2018 | 3.1% | 3.1% |
| Oct-2018 | 3.3% | 3.2% |
| Nov-2018 | 3.4% | 3.5% |
| Dec-2018 | 3.5% | 3.6% |
| Jan-2019 | 3.3% | 3.4% |
| Feb-2019 | 3.6% | 3.5% |
| Mar-2019 | 3.4% | 3.6% |
| Apr-2019 | 3.3% | 3.5% |
| May-2019 | 3.3% | 3.5% |
| Jun-2019 | 3.4% | 3.6% |
| Jul-2019 | 3.4% | 3.7% |
| Aug-2019 | 3.4% | 3.6% |
| Sep-2019 | 3.1% | 3.6% |
| Oct-2019 | 3.1% | 3.8% |
| Nov-2019 | 3.3% | 3.6% |
| Dec-2019 | 3.0% | 3.2% |
| Jan-2020 | 3.0% | 3.4% |
| Feb-2020 | 3.1% | 3.6% |
| Mar-2020 | 3.5% | 3.6% |
| Apr-2020 | 8.1% | 7.8% |
| May-2020 | 6.6% | 6.8% |
| Jun-2020 | 5.1% | 5.5% |
| Jul-2020 | 4.9% | 4.9% |
| Aug-2020 | 4.8% | 5.0% |
| Sep-2020 | 4.8% | 4.8% |
| Oct-2020 | 4.7% | 4.6% |
| Nov-2020 | 4.6% | 4.7% |
| Dec-2020 | 5.4% | 5.6% |
| Jan-2021 | 5.2% | 5.3% |
| Feb-2021 | 5.4% | 5.1% |
| Mar-2021 | 4.5% | 5.1% |
| Apr-2021 | 0.6% | 1.5% |
| May-2021 | 2.3% | 2.8% |
| Jun-2021 | 4.0% | 4.2% |
| Jul-2021 | 4.3% | 5.1% |
| Aug-2021 | 4.4% | 5.3% |
| Sep-2021 | 4.9% | 6.0% |
| Oct-2021 | 5.4% | 6.5% |
| Nov-2021 | 5.4% | 6.5% |
| Dec-2021 | 5.0% | 6.3% |
| Jan-2022 | 5.7% | 6.9% |
| Feb-2022 | 5.3% | 6.8% |
| Mar-2022 | 5.9% | 7.0% |
| Apr-2022 | 5.7% | 6.9% |
| May-2022 | 5.6% | 6.7% |
| Jun-2022 | 5.4% | 6.7% |
| Jul-2022 | 5.5% | 6.5% |
| Aug-2022 | 5.4% | 6.2% |
| Sep-2022 | 5.1% | 5.9% |
| Oct-2022 | 5.0% | 5.8% |
| Nov-2022 | 5.1% | 5.9% |
| Dec-2022 | 4.9% | 5.5% |
| Jan-2023 | 4.5% | 5.2% |
| Feb-2023 | 4.7% | 5.4% |
| Mar-2023 | 4.6% | 5.4% |
| Apr-2023 | 4.6% | 5.2% |
| May-2023 | 4.4% | 5.0% |
| Jun-2023 | 4.6% | 4.9% |
| Jul-2023 | 4.6% | 4.9% |
| Aug-2023 | 4.5% | 4.8% |
| Sep-2023 | 4.4% | 4.7% |
| Oct-2023 | 4.2% | 4.5% |
| Nov-2023 | 4.1% | 4.5% |
| Dec-2023 | 4.1% | 4.4% |
| Jan-2024 | 4.3% | 4.6% |
| Feb-2024 | 4.2% | 4.4% |
| Mar-2024 | 4.2% | 4.2% |
| Apr-2024 | 4.0% | 4.0% |
| May-2024 | 4.1% | 4.1% |
| Jun-2024 | 3.9% | 4.1% |
| Jul-2024 | 3.6% | 4.0% |
| Aug-2024 | 4.0% | 4.2% |
| Sep-2024 | 3.9% | 4.2% |
| Oct-2024 | 4.1% | 4.2% |
| Nov-2024 | 4.2% | 4.1% |
| Dec-2024 | 4.0% | 4.0% |
| Jan-2025 | 3.9% | 4.0% |
| Feb-2025 | 3.9% | 4.2% |
| Mar-2025 | 3.9% | 3.9% |
| Apr-2025 | 3.9% | 4.1% |
| May-2025 | 3.9% | 4.0% |
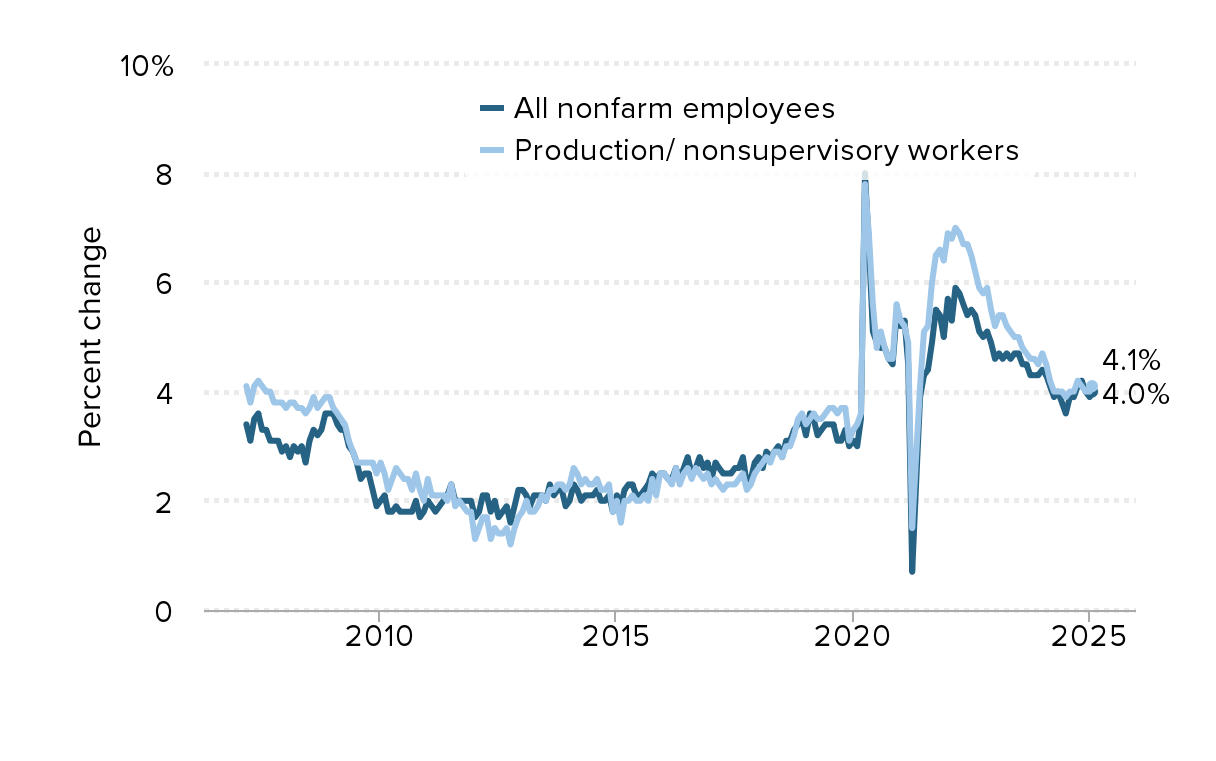
Source: EPI analysis of Bureau of Labor Statistics Current Employment Statistics public data series.
Mind the wage gap: Cumulative nominal average hourly earnings, actual and hypothetical if they had grown at 3.5% since the recession began, 2007–2025
Nominal Wage Tracker
Mind the wage gap: Cumulative nominal average hourly earnings, actual and hypothetical if they had grown at 3.5% since the recession began, 2007–2025
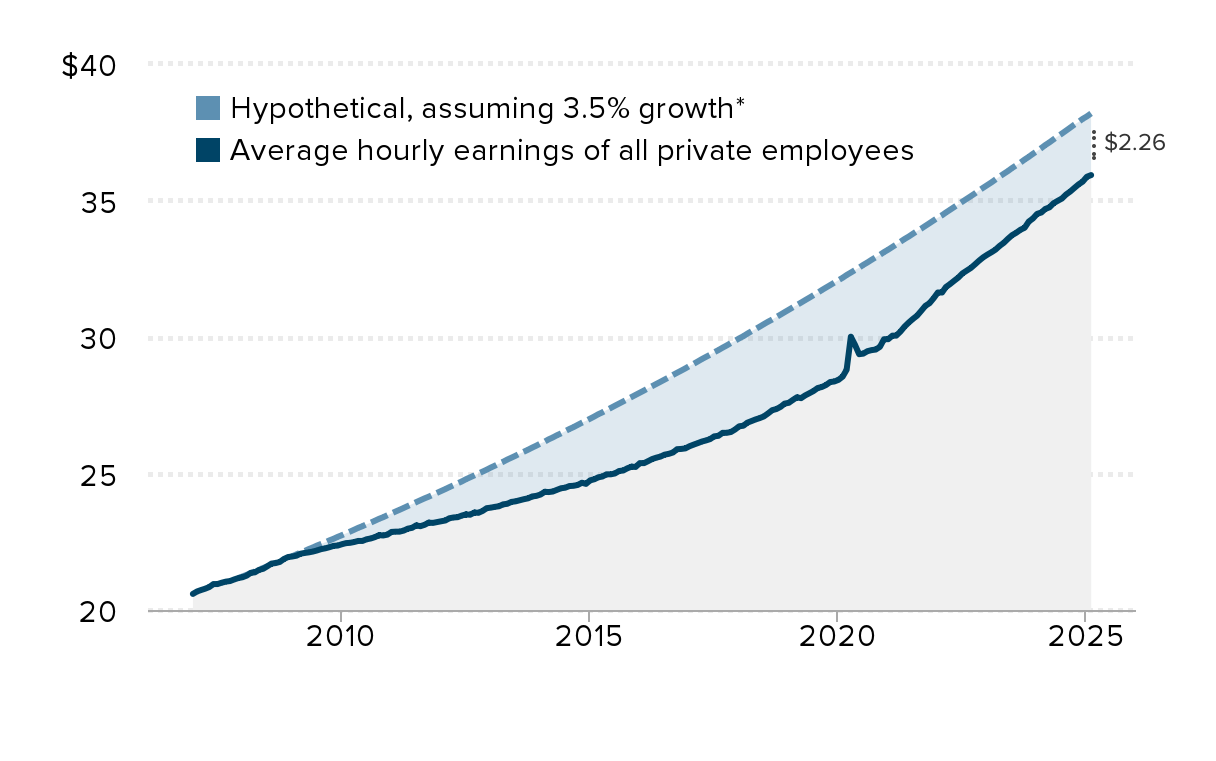
$2.28
* Nominal wage growth consistent with the Federal Reserve Board’s 2 percent inflation target, 1.5 percent productivity growth, and a stable labor share of income
Source: EPI analysis of Bureau of Labor Statistics Current Employment Statistics public data series
Workers’ share of corporate income hasn’t recovered: Share of corporate-sector income received by workers over recent business cycles, 1979–2024
Nominal Wage Tracker
Workers' share of corporate income hasn't recovered: Share of corporate-sector income received by workers over recent business cycles, 1979–2024
| date | Labor share |
|---|---|
| Jan-1979 | 79.1% |
| Apr-1979 | 79.5% |
| Jul-1979 | 80.3% |
| Oct-1979 | 80.8% |
| Jan-1980 | 81.3% |
| Apr-1980 | 82.8% |
| Jul-1980 | 82.0% |
| Oct-1980 | 80.6% |
| Jan-1981 | 80.4% |
| Apr-1981 | 80.4% |
| Jul-1981 | 79.6% |
| Oct-1981 | 80.5% |
| Jan-1982 | 81.5% |
| Apr-1982 | 80.9% |
| Jul-1982 | 81.0% |
| Oct-1982 | 81.6% |
| Jan-1983 | 81.0% |
| Apr-1983 | 79.9% |
| Jul-1983 | 79.5% |
| Oct-1983 | 79.1% |
| Jan-1984 | 77.8% |
| Apr-1984 | 78.0% |
| Jul-1984 | 78.5% |
| Oct-1984 | 78.4% |
| Jan-1985 | 78.5% |
| Apr-1985 | 78.7% |
| Jul-1985 | 78.4% |
| Oct-1985 | 79.8% |
| Jan-1986 | 80.1% |
| Apr-1986 | 81.0% |
| Jul-1986 | 81.7% |
| Oct-1986 | 82.0% |
| Jan-1987 | 82.0% |
| Apr-1987 | 81.2% |
| Jul-1987 | 80.7% |
| Oct-1987 | 81.2% |
| Jan-1988 | 81.2% |
| Apr-1988 | 81.2% |
| Jul-1988 | 81.1% |
| Oct-1988 | 80.4% |
| Jan-1989 | 80.9% |
| Apr-1989 | 81.1% |
| Jul-1989 | 81.2% |
| Oct-1989 | 82.2% |
| Jan-1990 | 82.1% |
| Apr-1990 | 81.9% |
| Jul-1990 | 82.9% |
| Oct-1990 | 83.4% |
| Jan-1991 | 82.4% |
| Apr-1991 | 82.7% |
| Jul-1991 | 83.1% |
| Oct-1991 | 83.6% |
| Jan-1992 | 83.2% |
| Apr-1992 | 83.3% |
| Jul-1992 | 83.7% |
| Oct-1992 | 83.2% |
| Jan-1993 | 83.6% |
| Apr-1993 | 82.9% |
| Jul-1993 | 82.8% |
| Oct-1993 | 81.6% |
| Jan-1994 | 81.6% |
| Apr-1994 | 81.4% |
| Jul-1994 | 80.8% |
| Oct-1994 | 80.5% |
| Jan-1995 | 80.8% |
| Apr-1995 | 80.5% |
| Jul-1995 | 79.7% |
| Oct-1995 | 79.8% |
| Jan-1996 | 79.3% |
| Apr-1996 | 79.2% |
| Jul-1996 | 79.4% |
| Oct-1996 | 79.5% |
| Jan-1997 | 79.1% |
| Apr-1997 | 79.0% |
| Jul-1997 | 78.4% |
| Oct-1997 | 78.7% |
| Jan-1998 | 79.8% |
| Apr-1998 | 80.1% |
| Jul-1998 | 80.0% |
| Oct-1998 | 80.6% |
| Jan-1999 | 80.4% |
| Apr-1999 | 80.7% |
| Jul-1999 | 81.1% |
| Oct-1999 | 81.5% |
| Jan-2000 | 81.8% |
| Apr-2000 | 82.0% |
| Jul-2000 | 82.5% |
| Oct-2000 | 83.2% |
| Jan-2001 | 83.2% |
| Apr-2001 | 82.9% |
| Jul-2001 | 83.1% |
| Oct-2001 | 84.1% |
| Jan-2002 | 82.3% |
| Apr-2002 | 82.0% |
| Jul-2002 | 81.8% |
| Oct-2002 | 80.8% |
| Jan-2003 | 80.3% |
| Apr-2003 | 80.2% |
| Jul-2003 | 79.8% |
| Oct-2003 | 79.9% |
| Jan-2004 | 78.7% |
| Apr-2004 | 78.6% |
| Jul-2004 | 78.5% |
| Oct-2004 | 78.4% |
| Jan-2005 | 77.1% |
| Apr-2005 | 76.8% |
| Jul-2005 | 76.9% |
| Oct-2005 | 75.7% |
| Jan-2006 | 75.3% |
| Apr-2006 | 75.2% |
| Jul-2006 | 74.6% |
| Oct-2006 | 75.9% |
| Jan-2007 | 77.2% |
| Apr-2007 | 76.7% |
| Jul-2007 | 78.0% |
| Oct-2007 | 79.0% |
| Jan-2008 | 79.5% |
| Apr-2008 | 79.5% |
| Jul-2008 | 79.8% |
| Oct-2008 | 83.6% |
| Jan-2009 | 79.8% |
| Apr-2009 | 79.4% |
| Jul-2009 | 78.4% |
| Oct-2009 | 77.4% |
| Jan-2010 | 76.3% |
| Apr-2010 | 76.8% |
| Jul-2010 | 74.8% |
| Oct-2010 | 74.9% |
| Jan-2011 | 77.1% |
| Apr-2011 | 75.9% |
| Jul-2011 | 76.0% |
| Oct-2011 | 74.2% |
| Jan-2012 | 73.9% |
| Apr-2012 | 74.1% |
| Jul-2012 | 74.4% |
| Oct-2012 | 75.1% |
| Jan-2013 | 74.7% |
| Apr-2013 | 75.0% |
| Jul-2013 | 75.1% |
| Oct-2013 | 74.8% |
| Jan-2014 | 76.0% |
| Apr-2014 | 74.1% |
| Jul-2014 | 73.3% |
| Oct-2014 | 73.7% |
| Jan-2015 | 74.2% |
| Apr-2015 | 74.3% |
| Jul-2015 | 74.9% |
| Oct-2015 | 75.3% |
| Jan-2016 | 74.9% |
| Apr-2016 | 75.4% |
| Jul-2016 | 75.4% |
| Oct-2016 | 75.6% |
| Jan-2017 | 75.9% |
| Apr-2017 | 75.9% |
| Jul-2017 | 76.3% |
| Oct-2017 | 76.1% |
| Jan-2018 | 75.8% |
| Apr-2018 | 75.3% |
| Jul-2018 | 75.2% |
| Oct-2018 | 75.4% |
| Jan-2019 | 76.0% |
| Apr-2019 | 76.0% |
| Jul-2019 | 75.5% |
| Oct-2019 | 75.5% |
| Jan-2020 | 77.7% |
| Apr-2020 | 77.1% |
| Jul-2020 | 72.9% |
| Oct-2020 | 75.5% |
| Jan-2021 | 73.3% |
| Apr-2021 | 71.8% |
| Jul-2021 | 72.5% |
| Oct-2021 | 72.9% |
| Jan-2022 | 73.2% |
| Apr-2022 | 72.1% |
| Jul-2022 | 71.8% |
| Oct-2022 | 71.5% |
| Jan-2023 | 71.9% |
| Apr-2023 | 72.1% |
| Jul-2023 | 71.6% |
| Oct-2023 | 71.0% |
| Jan-2024 | 71.7% |
| Apr-2024 | 71.4% |
| Jul-2024 | 71.1% |
| Oct-2024 | 71.1% |
| Jan-2025 | 72.0% |
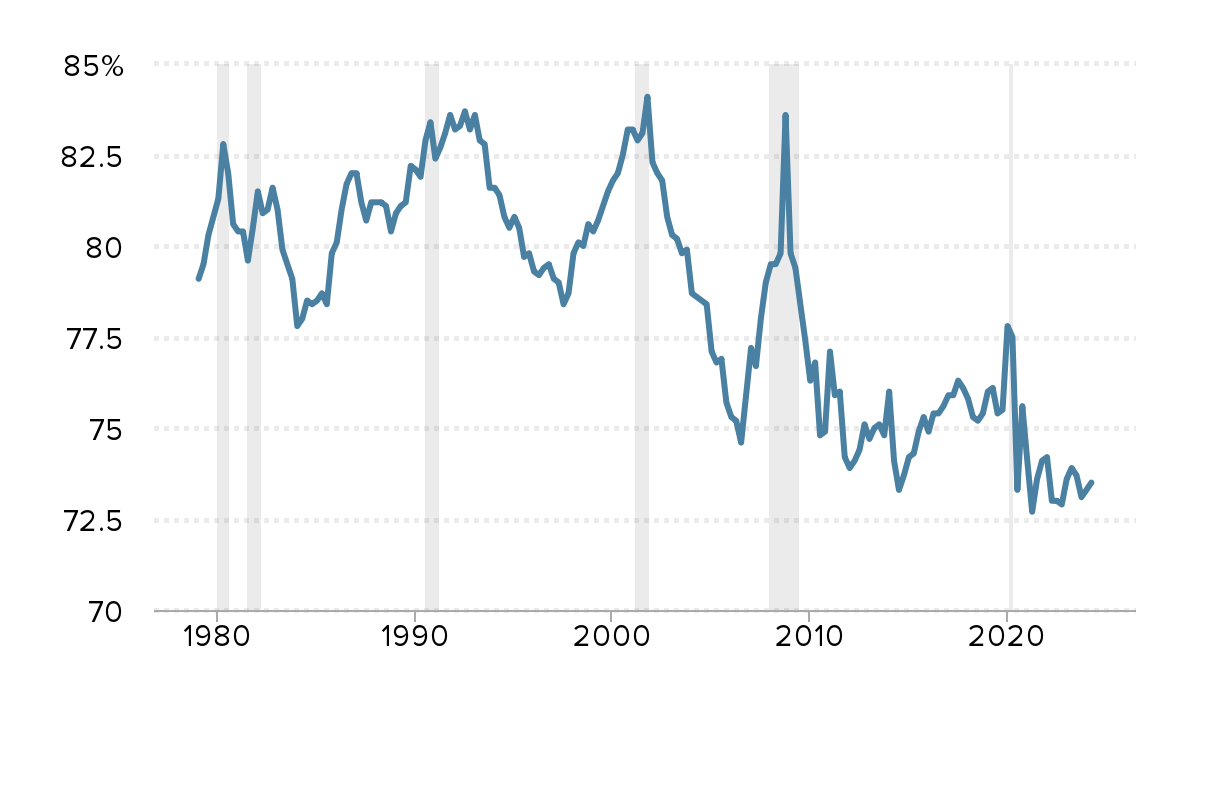
Notes: Shaded areas denote recessions. Federal Reserve banks’ corporate profits were netted out in the calculation of labor share.
Source: EPI analysis of Bureau of Economic Analysis National Income and Product Accounts (Tables 1.14 and 6.16D)