

First, the good news
The U.S. Census Bureau recently released its 2016 Business Dynamics Statistics, providing the authoritative latest figures on startup activity across all sectors of the U.S. economy. It came bearing modest good news: 2016 was the best year for U.S. business formation since the financial crisis. In total 433,000 new firms launched in 2016, an increase of 19,000 over 2015 numbers.
A little perspective
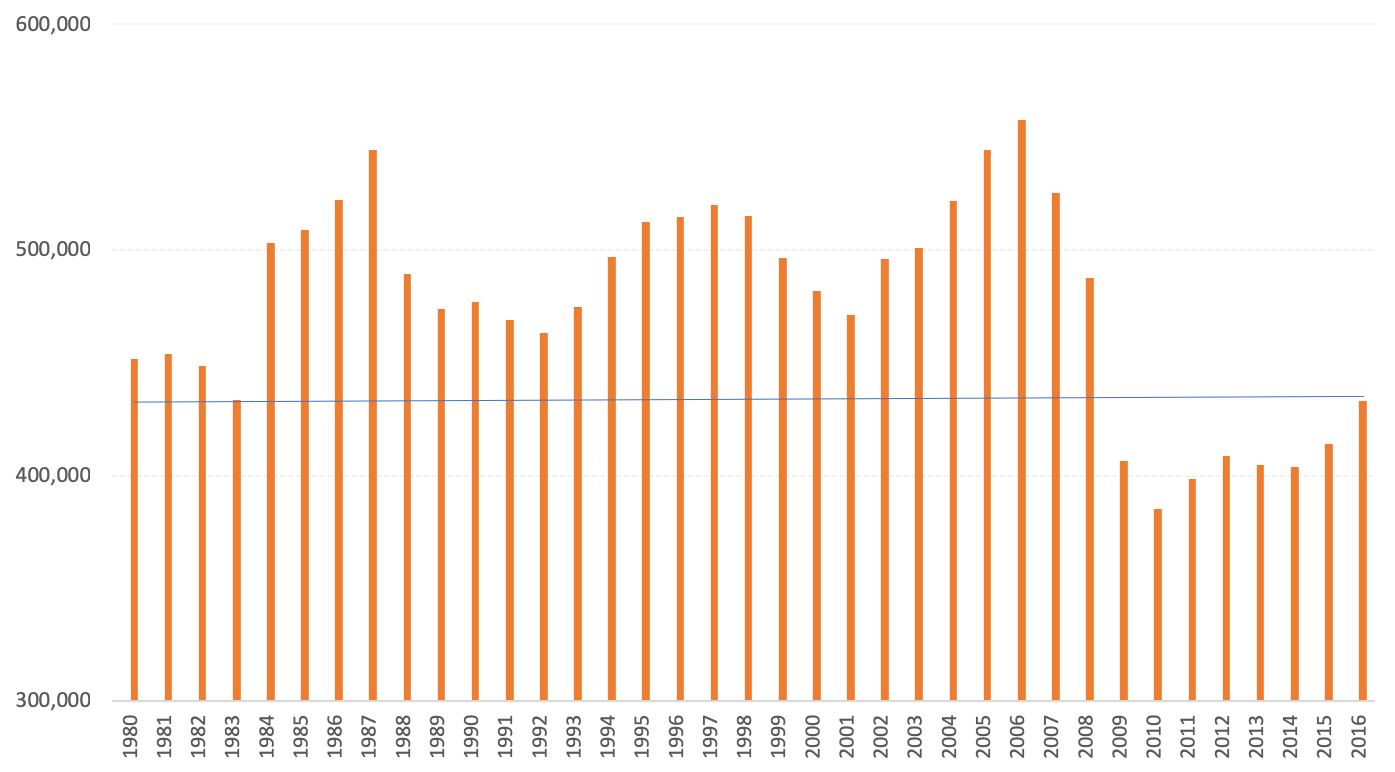
The long term picture is less rosy, however. Startup activity still remains well below historical norms. In fact, the number of new firms launched in 2016 was still 125,000 short of the number launched in 2006 and 64,400 short of the long-running average over the decades prior to the 2008 financial crisis. In fact, while 2016 saw the highest number of startups since the Great Recession, the number was still lower than any year in the pre-recessionary period from 1980 to 2008 (as marked by the line in the below chart).
Total number of startups
The startup rate–defined as the percent of firms in the economy started in the past year–also rose slightly to 8.4 percent in 2016 from 8.1 percent in 2015, but it remains well below its long-run average by at least 2 percentage points. The financial crisis coincided with a collapse in the rate at which the U.S. economy produces new firms, and the startup rate remains one of the few economic indicators that has barely recovered in the years since. Importantly, a growing body of academic literature confirms that the phenomenon is widespread across industry sectors and cannot be readily explained away by dynamics within the retail sector, for example. The trend is in fact more pronounced in so-called high-tech sectors. Moreover, firms are not only less likely to start than in the past, but even the most high-potential ones in every new cohort fail to survive and scale at rates similar to the not-too-distant past.
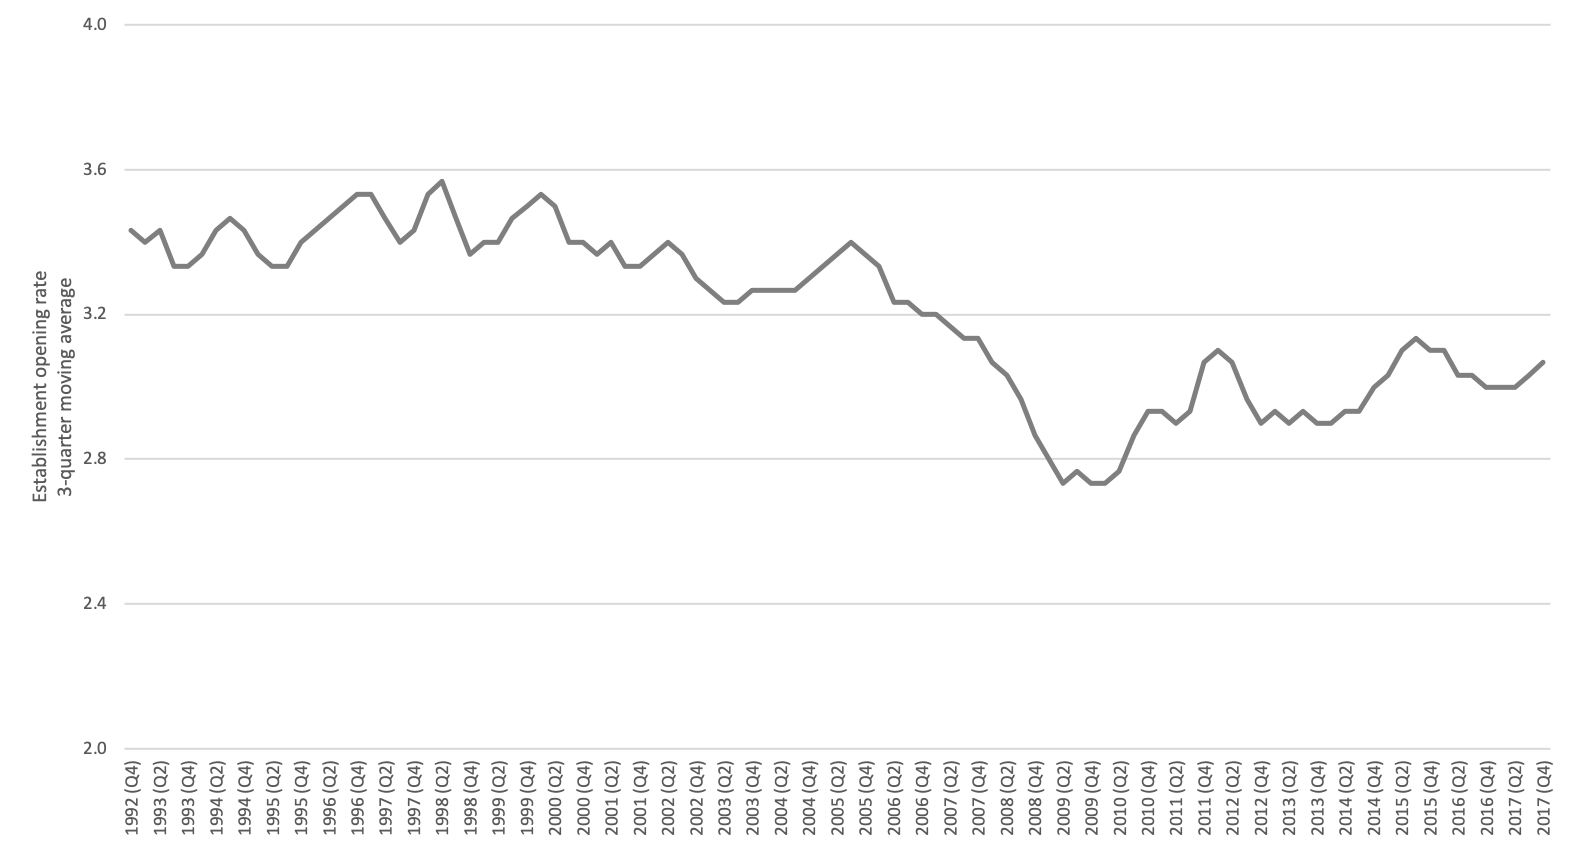
The U.S. Department of Labor provides slightly more current numbers on quarterly establishment openings and closings with their Business Employment Dynamics database, completing the picture through Q4 2017. Establishments are individual places of business (discrete addresses) owned by firms. The concept is distinct from firms (every new Starbucks is a new establishment but clearly not a new firm) but both measures move together. These figures suggest that firm start rates, if they continue to track establishment openings rates, may have fallen back slightly from 2016’s high point and certainly haven’t accelerated.
Quarterly establishment opening rate, 1992 to 2017
Creative destruction unwinding
Contrary to popular perception, the rate at which firms fail today is also depressed. The firm death rate, in the jargon, remains a percentage point lower than its long-term historical average. From 2015 to 2016, the firm death rate was essentially unchanged at 7.7 percent. Far from an unprecedented era of disruption and transformation, the current period is one in which the forces of both creation and destruction remain unusually subdued.
Firm Startup and Closure Rates, 1980 to 2016 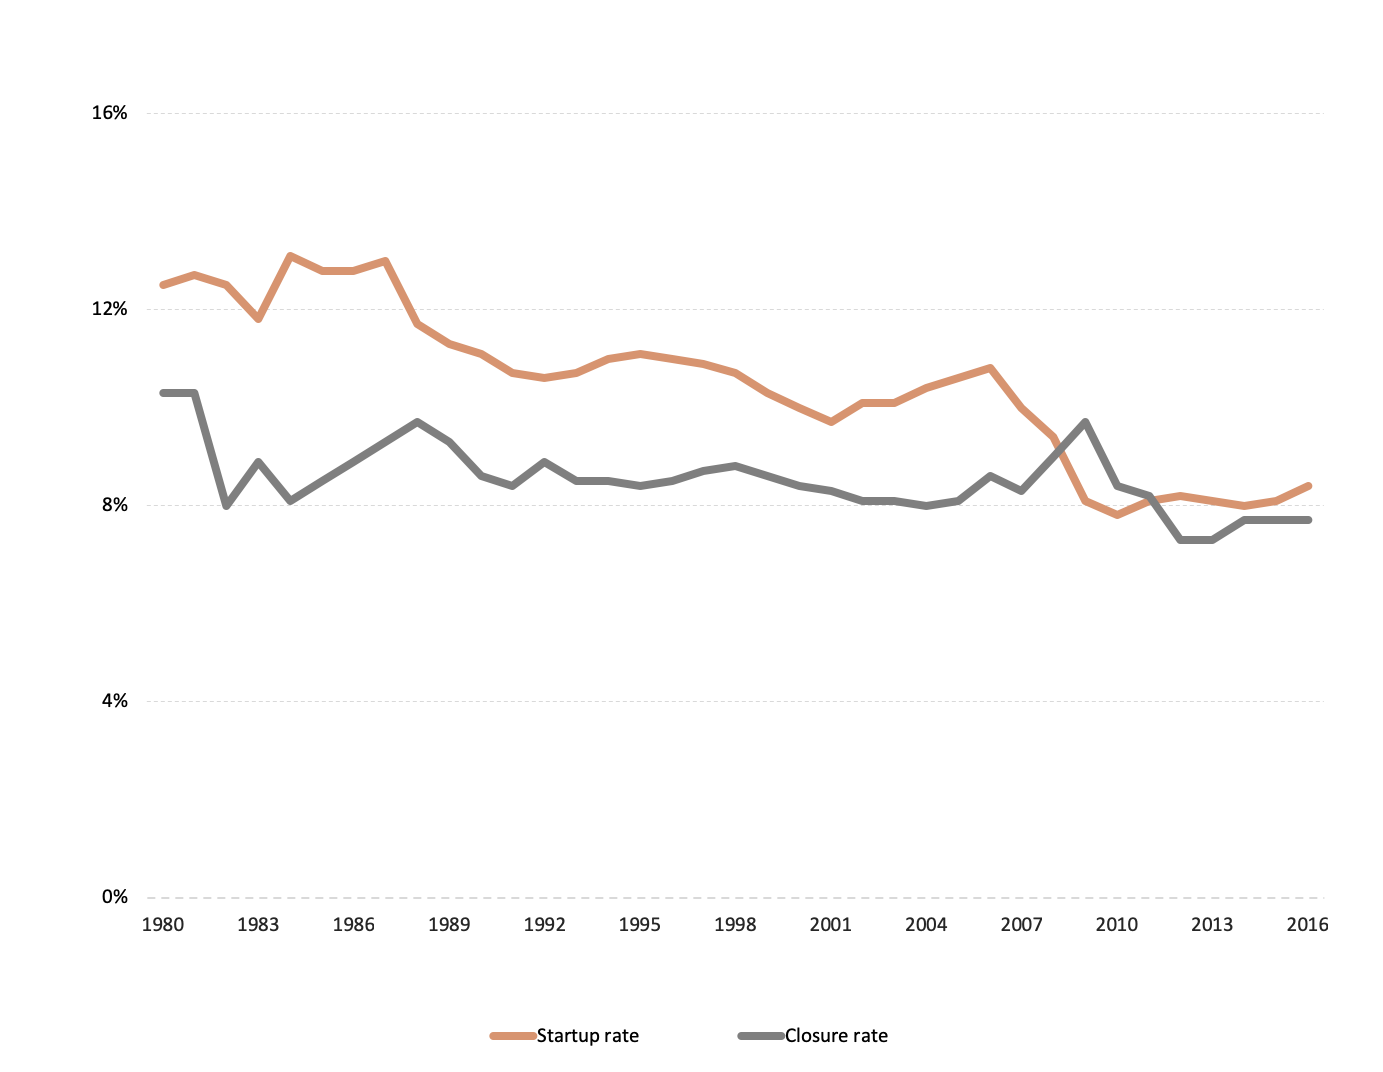
Indeed, the post-recession period remains one of the least disruptive in modern economic history. Across the landscape of firms that compose the U.S. economy, absolute levels of churn or turnover — the total share of new and dying firms — in the U.S. economy still stand near their all-time lows thanks to missing entrepreneurs and low business death rates. Furthermore, the gap between the birth and death rates has shrunk dramatically. The positive delta between birth and death rates is currently a meager 0.7%, compared to 1.7% in 2007, and a historic average of 2.0%. As a result, even though the U.S. economy has grown by trillions of dollars, it produces fewer new firms on net annually than it did before the Great Recession struck.
Absolute churn in the U.S. economy, 1980-2016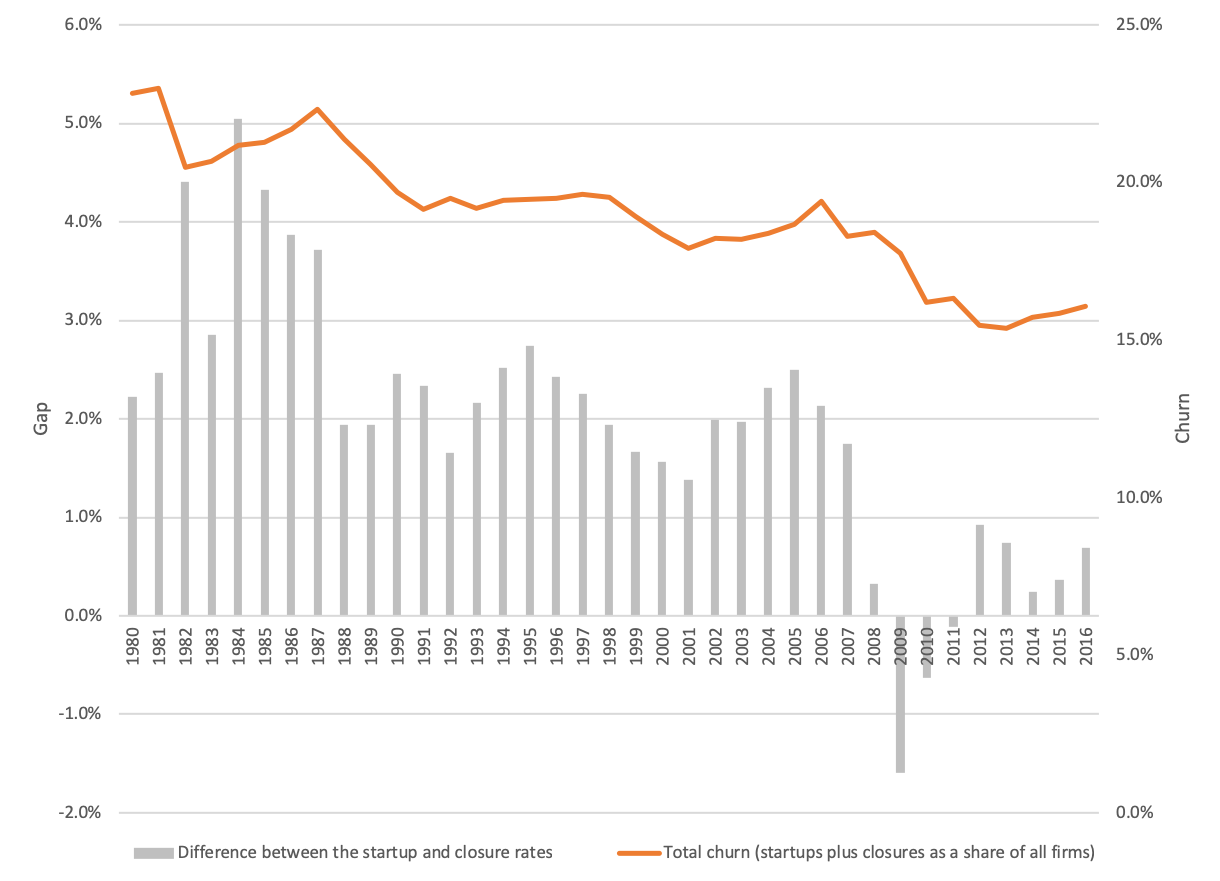
Dynamism in retreat
Other metrics of dynamism across the economy follow similar trajectories, suggesting that the declining startup rate is part of a bigger transformation. Take the workforce turnover rate, or the rate at which workers change jobs. This measure of the flexibility of the labor market moves in tandem with recessions and then consistently fails to subsequently recover to previous levels, ratcheting enduringly lower over time in a stair-step pattern. The turnover rate for prime age adults at the end of 2016, the most recent quarter for which data is available from this source (Census Bureau’s Quarterly Workforce Indicators), was still well below the rate posted in the trough of the 2001 recession. Even as full employment nears at the top of a decade-long economic expansion, turnover rates only barely now match those from the depths of the prior recession.
Workforce turnover rate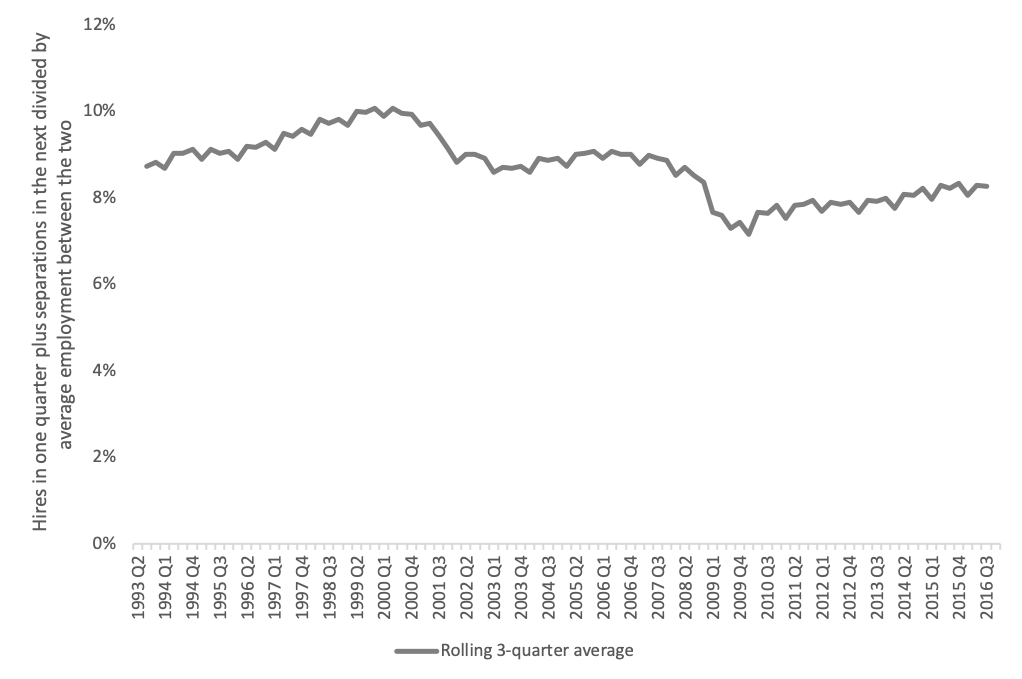
Startups’ employment impact remains diminished in the wake of the financial crisis as well, with new firms only employing 2.1 percent of the all workers in 2016, in line with the post-recession average, but below the 3 percent average seen in the decades prior. In absolute terms, there were over half a million fewer jobs in startups in 2016 than the historical norm.
Change in Share of Employment, 1992 to 2016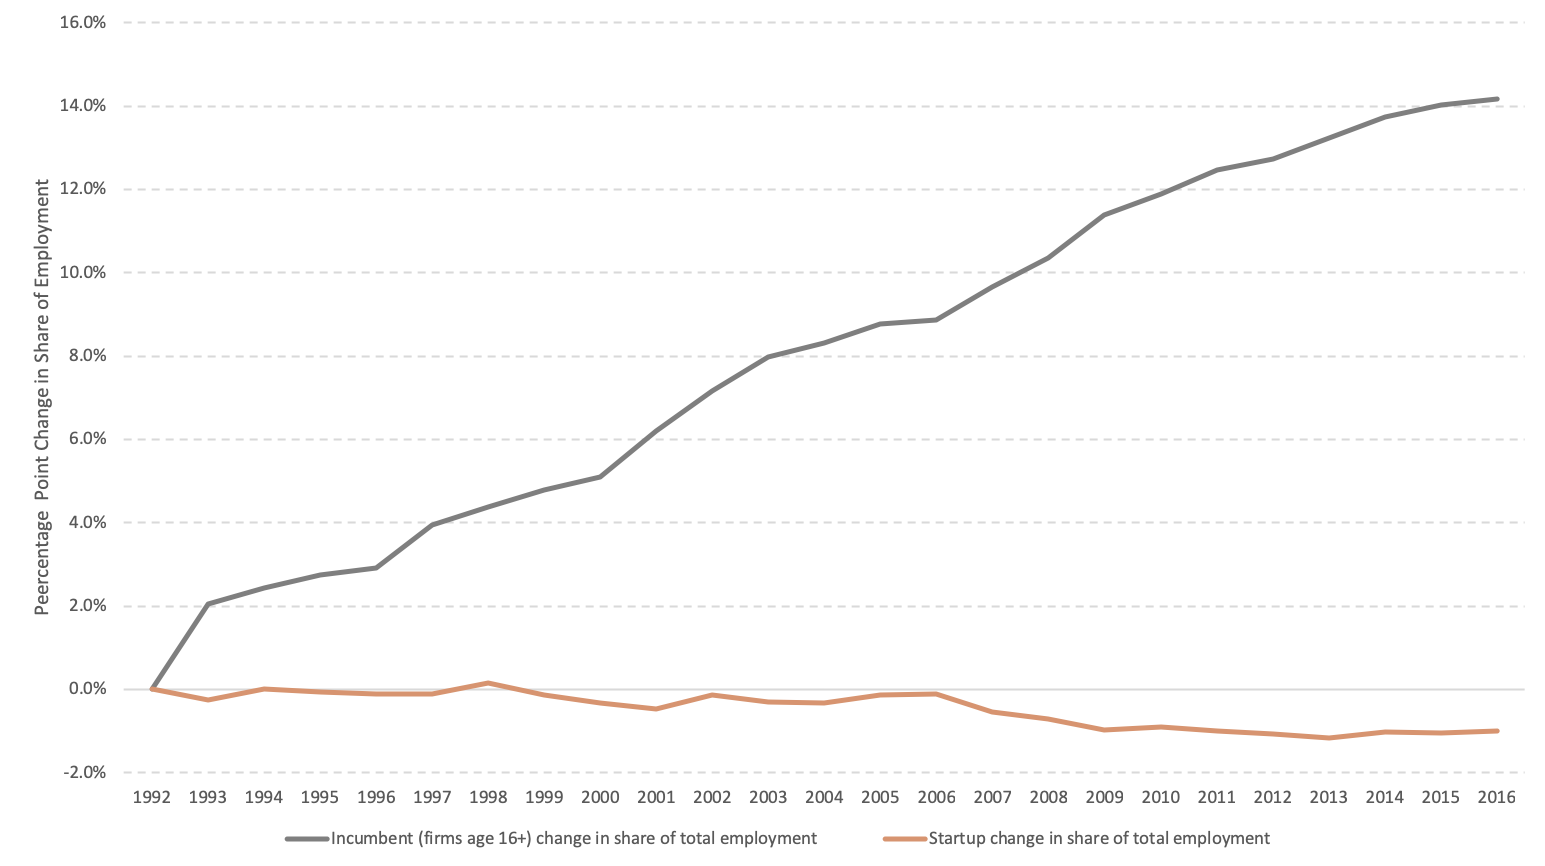
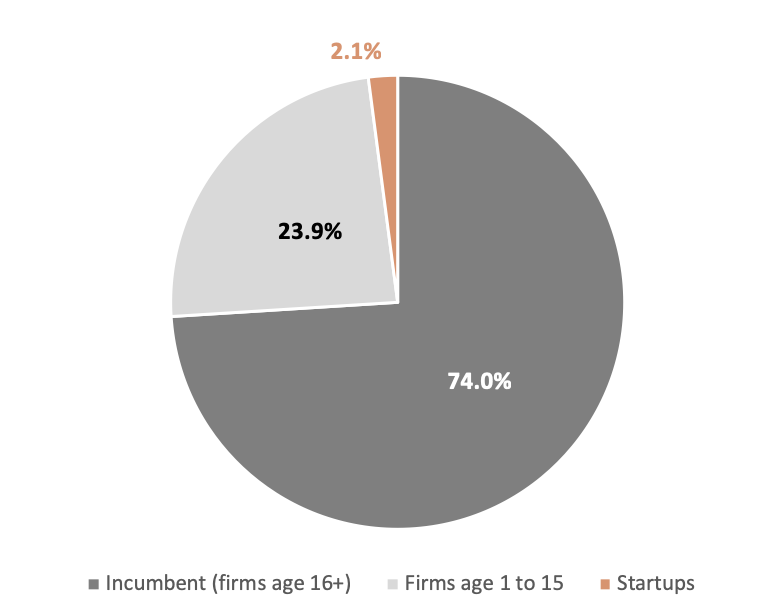
Meanwhile aging incumbent firms’ claim on the workforce continues to expand. The share of all U.S. jobs found in firms at least 16 years old reached 74 percent in 2016, its highest threshold ever.
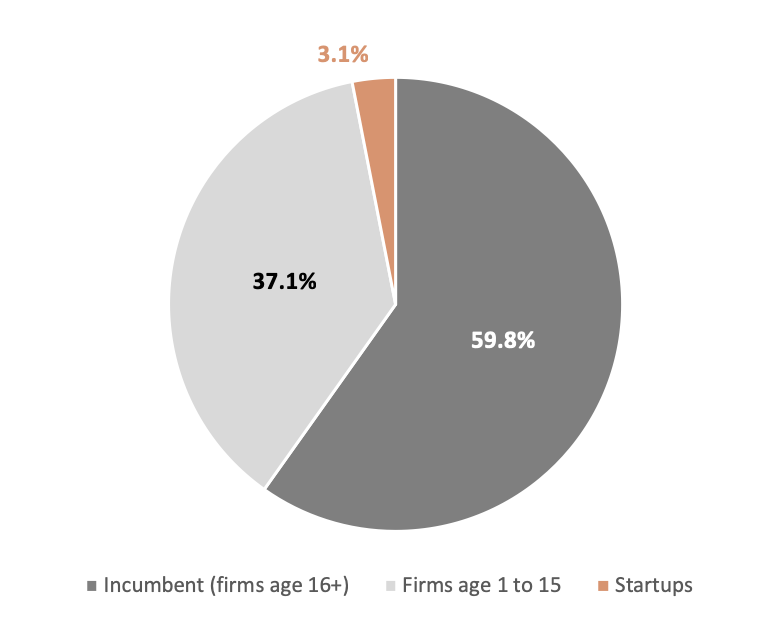
Share of employment, 1992
Share of employment, 2016
Whodunnit?
What explains this winding down of the U.S. economy’s storied dynamism? An important December 2018 NBER study by Hopenhayn, et al, offers some compelling suggestions. The authors find that both the declining startup rate and the rising dominance of older firms can in large part be attributed to demographic factors, namely declining birth rates in the population writ large and the passing of the baby boomer bulge, which would have initially elevated startup rates in the 1970s and 1980s before reversing. With population growth now at an 80 year low on the most recent numbers, it seems that the country’s demographic reckoning is beginning to make itself felt in the economy.
And yet demographics can only be part of the story. The startup rate’s abrupt drop around the Great Recession implies that something other than long-term, structural transformations (demographic shifts, technological change, digitization, or a shift toward services, say) lie at least in part behind the abnormally depressed levels of startup activity that have characterized the recovery period. Demographics have difficulty explaining the lower survival and scaling rates of new and especially high-tech firms–trends for which the year 2000 appears to be the pivotal inflection point. Developments rooted in policy, competition, financial markets, or Americans’ risk tolerance, for example, must be contributing to the macro trend as well.
Looking ahead
The welcome slight uptick in startup activity in 2016, seven years into an economic recovery, should be celebrated but does not justify complacency. The Great Recession’s impact on the entrepreneurial vitality of the U.S. economy persists, and longer-term trends point to an even less dynamic future.
The United States continues to start and scale new firms at far lower rates and in far smaller numbers than it did in the past. As we’ve written elsewhere, this development has serious implications for the future potential of the economy to generate wage growth, productivity advances, and a balanced geography of economic development. While the causes are complex and not well-understood, many of the partial solutions are obvious: opening our doors to greater numbers of skilled and entrepreneurial immigrants and eliminating the use of startup-snuffing, opportunity-inhibiting noncompete agreements, to name two examples from EIG’s research and policy agenda in the year ahead. Stay tuned.